Trading BRICs currency for 2026
We found 11 online brokers that are appropriate for Trading BRICs Currency Platforms.
Trading BRICs currency Guide
Analysis by Andrew Blumer, Updated and fact-checked by Senad Karaahmetovic, Last updated – October 07, 2026
Trading BRICS Currency
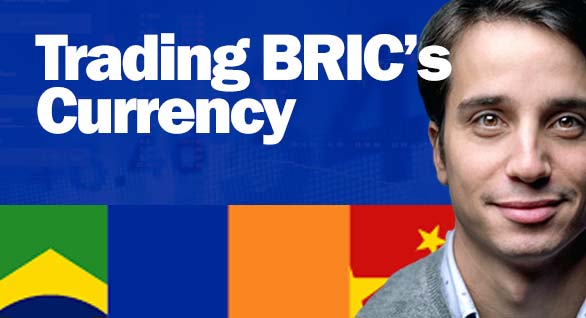
Please note: As of 2026, the BRICS currency remains in development stages, with BRICS Pay pilots running through 2025 to 2027 and a possible settlement unit projected for 2028 to 2030.
I first became interested in BRICS currencies back in 2022 when I noticed how often these nations appeared in financial headlines. My initial exploration began with the Chinese Yuan, which I could access through my regular forex broker with a spread of around 8 to 15 pips during peak trading hours. I remember placing my first trade during the Shanghai market open and watching how differently it moved compared to the Euro or Dollar pairs I was used to.
The Russian Ruble presented a completely different challenge. After geopolitical tensions escalated in early 2022, I watched the currency swing from roughly 75 Rubles per Dollar to over 130, then back down to the 90 to 100 range within months. I learned quickly that trading BRICS currencies requires understanding political developments, not just technical charts. My attempt to trade the Ruble during this volatility taught me that these markets can gap significantly overnight, and I once lost 3% of my account on a single gap down that bypassed my stop loss entirely.
The Indian Rupee became my steady companion for carry trades. With interest rates often hovering between 4% and 6%, holding long positions overnight earned me noticeable swap payments. I recall holding a position for three months in 2023, collecting approximately $12 to $15 per lot per day in positive swap, which added up to a significant portion of my overall return. However, liquidity could be thin outside Indian market hours, and I learned to avoid entering new positions during the lunch break in Mumbai when spreads would widen dramatically.
The Brazilian Real fascinated me with its connection to commodity prices. I developed a habit of checking coffee and iron ore futures before trading the Real, as these correlations often preceded currency moves by several hours. In one memorable trade during 2021, I caught a 400 pip move over two days when soybean prices surged, turning my $500 position into over $1,200 after accounting for spreads and swaps.
The South African Rand proved to be the most unpredictable in my experience. Gold price movements would send the Rand soaring or plunging with little warning. I remember a day in March 2023 when gold dropped $30 in an hour, and the Rand followed with a 2% move against the Dollar. My broker's spread on the Rand often ranged from 20 to 50 pips, significantly wider than major pairs, which meant I needed larger moves just to break even.
What strikes me most about trading these currencies is how they force you to think beyond traditional forex fundamentals. In early 2026, I attended a webinar discussing India's BRICS chairmanship and the bloc's pivot away from a single common currency toward a more pragmatic approach. Rather than creating a unified BRICS currency, the focus has shifted to linking national Central Bank Digital Currencies through interoperable payment systems. This infrastructure first strategy aims to reduce conversion costs for trade between member nations by an estimated 15% to 20% without requiring countries to surrender monetary sovereignty.
The BRICS Pay system, which entered pilot stages in late 2024, represents the current reality. A prototype demonstration in Moscow showed the technical capacity to process up to 20,000 messages per second using blockchain and distributed consensus nodes. However, as of February 2026, the system remains in early deployment with hopes for broader operational rollout by late 2025 or into 2026. The platform integrates existing national systems like Brazil's Pix, India's UPI, China's CIPS, and Russia's SPFS, creating a network of bilateral settlement corridors rather than a centralized currency.
Recent developments have significantly altered the trading landscape. Indonesia joined BRICS in early 2025 and announced plans to launch yuan centered foreign exchange operations, with local currency transactions between Indonesia and China already reaching around $1 billion monthly. Meanwhile, Russia and China settled 99.1% of their trade payments in rubles and yuan by late 2024, demonstrating that bilateral national currency settlement is already functioning at scale.
For anyone considering entering these markets, I recommend starting with micro lots and never risking more than 1% of your capital per trade. My early mistakes came from treating these currencies like the Euro or Yen, when in reality, they each carry unique risks tied to emerging market volatility, political shifts, and commodity cycles. The opportunities are genuine, I have personally profited from the high interest rate differentials and strong trends these currencies can exhibit, but the journey requires patience, continuous learning, and respect for the distinct character of each nation's economic story.
Looking ahead to 2026 and beyond, the landscape continues evolving rapidly. President Trump has threatened 100% tariffs on BRICS members pursuing alternative currencies, creating additional volatility and political risk. Gold prices surged over $5,500 per ounce in early 2026 as central banks accelerated purchases, with foreign central banks' collective gold holdings surpassing their US Treasury holdings for the first time in nearly three decades. This shift toward neutral assets signals eroding confidence in dollar centric systems while creating new correlations for traders to monitor. Things wont change anytime soon, but an alternative track is virtually a historical inevitability, and BRICS, with India leading the 2026 agenda, is laying the first tracks.
Example BRICS Trade
An example of a currency pair for trading within the BRICS (Brazil, Russia, India, China, and South Africa) group would be the USD/ZAR (U.S. Dollar/South African Rand) or USD/BRL (U.S. Dollar/Brazilian Real). For direct BRICS-to-BRICS currency trading, you could consider pairs such as BRL/ZAR (Brazilian Real/South African Rand), CNY/INR (Chinese Yuan/Indian Rupee), or RUB/BRL (Russian Ruble/Brazilian Real), though these might be less common and may have lower liquidity compared to trading BRICS currencies against the U.S. Dollar.
USD/ZAR Trade As BRICS Trade Example
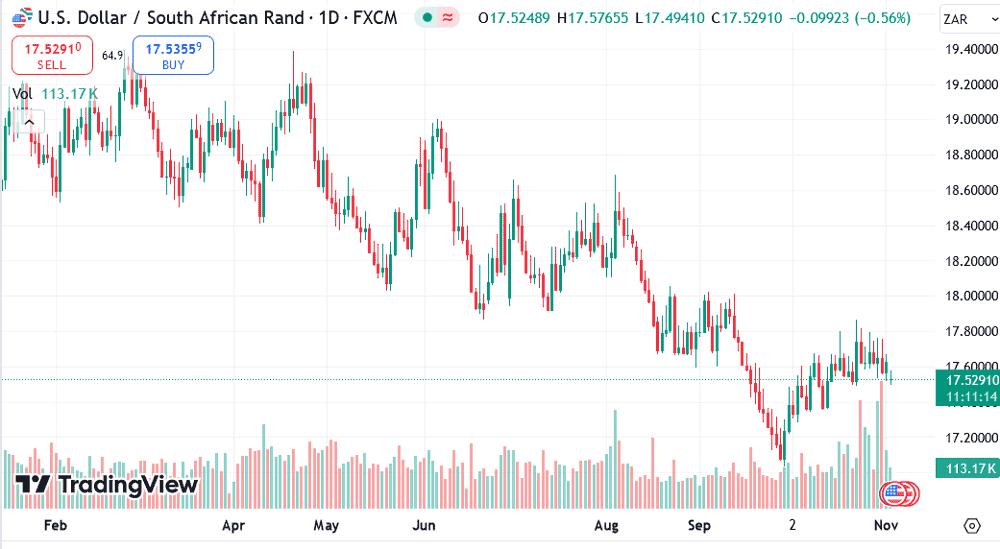
The USD/ZAR currency pair represents the value of the U.S. Dollar against the South African Rand. In this example, the pair is priced at 15.98 USD, which means that 1 U.S. Dollar is equivalent to approximately 15.98 South African Rand at current mid-market rates.
Assume you are trading with $10,000. If you decide to go long on the USD/ZAR pair, you are essentially betting that the U.S. Dollar will strengthen against the South African Rand. At the current price of 15.98, your $10,000 would be exchanged for about 159,800 ZAR if the trade is executed at this rate.
The USD/ZAR trade is linked to the BRICS economy because South Africa is a member of the BRICS group, which consists of Brazil, Russia, India, China, and South Africa. These countries are known for their emerging economies and play a significant role in global trade and finance. Trading BRICS currencies can be attractive due to their potential for high returns but often comes with higher volatility and risks compared to major currency pairs.
Volatility in trading USD/ZAR can be influenced by various factors, including economic data releases, geopolitical events, and shifts in commodity prices, particularly those that impact South Africa’s exports such as gold and platinum. This higher volatility can lead to rapid price movements, which could amplify both profits and losses.
If the trade goes in your favor and the U.S. Dollar strengthens (meaning the USD/ZAR price increases), you would be able to sell your ZAR back at a higher rate, converting it back to USD for a profit. For example, if the price rises to 16.50, your 159,800 ZAR would convert back to approximately $9,689, resulting in a profit relative to your original trade.
Conversely, if the trade goes against you and the U.S. Dollar weakens (meaning the USD/ZAR price decreases), you would incur a loss when converting back to USD. For example, if the price drops to 15.50, your 159,800 ZAR would convert to approximately $10,309, representing a loss compared to your initial investment.
Trading USD/ZAR within the context of BRICS currencies can offer significant opportunities due to potential price movements, but it is also accompanied by notable risks due to the pair’s inherent volatility. Proper risk management strategies are essential to navigate the challenges of trading such a dynamic currency pair.

What are the BRICS countries' national currencies and why join BRICS?
The BRICS countries, consisting of Brazil, Russia, India, China, and South Africa, represent a formidable alliance of emerging economies that play a critical role in the global marketplace. Each nation has its own unique currency, reflecting its economic structure, stability, and fiscal policies. Understanding these currencies is essential for grasping the economic dynamics within the BRICS bloc and their potential impact on global trade. Let's delve into the specific currencies associated with these countries, exploring their historical contexts, economic significance, and the factors that influence their value:
-
Brazil (Brazilian Real): Brazil, with its vast natural resources and diverse economy, uses the Brazilian Real (BRL) as its national currency. The Real has undergone several changes since its introduction in 1994, aimed at stabilizing the economy and controlling inflation. Its value is influenced by Brazil's agricultural exports, commodity prices, and political stability. By considering joining a BRICS currency framework, Brazil aims to diversify its trade options, reduce reliance on the US dollar, and enhance regional influence. However, it faces risks such as potential currency volatility and economic misalignment with other BRICS members.
-
Russia (Russian Ruble): Russia, known for its energy resources and technological advancements, employs the Russian Ruble (RUB) as its official currency. The Ruble's value is closely tied to oil prices and global demand for energy, making it sensitive to geopolitical tensions and economic sanctions. Entering a shared BRICS currency could help Russia mitigate the effects of Western sanctions and strengthen its position in a multi-polar world economy. On the downside, coordinating monetary policies with other member countries might lead to conflicts of interest or economic instability.
-
India (Indian Rupee): India, a hub of information technology and services, utilizes the Indian Rupee (INR) as its local currency. The Rupee's value is influenced by India's robust economic growth, foreign investment inflows, and trade balances, reflecting the nation's expanding role in the global economy. By participating in a BRICS currency, India could gain greater leverage in international trade and reduce currency exchange costs. However, it risks potential economic disruptions if the shared currency is not managed effectively, affecting national fiscal sovereignty.
-
China (Chinese Yuan Renminbi): China, the world's manufacturing hub and an economic powerhouse, operates with the Chinese Yuan Renminbi (CNY) as its official currency. The Yuan's value is affected by China's trade surplus, government policies, and its gradual integration into global financial markets. China’s entry into a BRICS currency system could boost its influence over global trade and provide an alternative to the US dollar-dominated financial system. The potential risks include balancing its monetary policies with those of less economically stable BRICS partners, which could impact the Yuan's stability.
-
South Africa (South African Rand): South Africa, rich in minerals and resources, conducts its economic activities using the South African Rand (ZAR) as its national currency. The Rand is sensitive to fluctuations in commodity prices, particularly gold and platinum, and reflects the country's economic and political landscape. For South Africa, joining a BRICS currency could mean better economic integration with major trading partners and reduced dependency on Western financial systems. However, the challenges lie in aligning its relatively smaller economy with larger BRICS economies, potentially leading to imbalances and economic vulnerabilities.
How does the volatility of BRICS currencies compare to major global currencies?
The volatility of BRICS currencies relative to major global currencies, such as the US Dollar (USD) and the Euro (EUR), has been a subject of significant scrutiny among economists and traders alike. This volatility is shaped by various factors, including economic conditions, geopolitical events, and market sentiment. Understanding the behavior of BRICS currencies in relation to major currencies is crucial for traders looking to capitalize on fluctuations and manage risk effectively. Here's a closer look at the volatility comparisons:
-
BRICS vs US Dollar (USD): BRICS currencies like the Brazilian Real (B), Russian Ruble (R), Indian Rupee (I), Chinese Yuan (C), and finally the South African Rand (S) have often exhibited higher volatility against the historically dominant USA Dollar. This volatility can be attributed to geopolitical events, domestic economic reforms, and shifts in market sentiment. For instance, political instability in any of the BRICS nations can lead to rapid depreciation against the USD, while positive economic news may enhance their strength.
-
BRICS vs Euro (EUR): Similar to their interactions with the USD, BRICS currencies can experience notable fluctuations when paired with the Euro. Economic growth differentials, trade relations, and political stability in both the Eurozone and BRICS countries significantly influence this volatility. Events such as Brexit or changes in European Central Bank policies can also create ripple effects that impact BRICS currencies.
-
Intra-BRICS Volatility: Among themselves, BRICS currencies can also experience fluctuations due to differing economic performances and geopolitical dynamics within the bloc. For example, the economic performance of China, as the largest BRICS economy, can have a significant impact on the value of other BRICS currencies, affecting trade relationships and investor confidence across the group.
While BRICS currencies may exhibit higher volatility compared to major global currencies, this volatility can also present trading opportunities for those who can effectively navigate and manage associated risks. Understanding the factors driving this volatility is essential for successful trading strategies in the BRICS currency markets.

What economic factors influence the exchange rates of BRICS currencies?
After trading BRICS currencies for several years, I have seen firsthand how these markets react to economic shifts. The exchange rates of BRICS currencies are influenced by a multitude of economic factors, reflecting both local and global dynamics. Understanding these factors is crucial for traders and investors aiming to anticipate currency movements and make informed decisions. Analyzing these elements can provide valuable insights into market behavior and enhance trading strategies.
Economic growth in BRICS countries often strengthens a currency's value due to its impact on investor confidence. When economies grow at a robust rate, it signals stability and potential for high returns on investments. This influx of foreign capital drives demand for local currencies, as investors need to exchange their currencies to invest in the growing economies. I remember when India reported 8.2% GDP growth in 2023, the Indian Rupee (INR) gained nearly 3% against the dollar within weeks as foreign portfolio investors poured billions into Indian equities. Rapid growth in sectors like technology or manufacturing can lead to a surge in currency demand, resulting in appreciation.
Interest rates play a significant role in currency valuation. Central banks in BRICS nations adjust interest rates to control inflation and stabilize the economy. When a central bank raises interest rates, it often attracts foreign capital seeking higher returns on investments, thereby boosting demand for that currency. Conversely, if interest rates are lowered, it can lead to capital outflows as investors seek better yields elsewhere, resulting in depreciation. In 2022, Brazil's central bank pushed rates to 13.75% to combat inflation, and I watched the Brazilian Real (BRL) strengthen from 5.20 to 4.70 against the dollar, offering traders substantial returns on carry trades.
Inflation is a critical economic indicator that affects currency strength. High inflation rates diminish the purchasing power of a currency, leading to decreased confidence among investors and potential depreciation. Central banks often respond by tightening monetary policy, which can lead to higher interest rates aimed at controlling inflation. When Russia experienced inflation spikes above 17% in 2022, the Russian Ruble (RUB) initially plummeted, forcing the Central Bank of Russia to hike rates to 20%. This aggressive response eventually stabilized the currency, though at the cost of significant market volatility that caught many traders off guard.
Trade balances significantly impact currency values. Creating higher demand for its currency in international markets. This increased demand can lead to appreciation. Conversely, a trade deficit can result in depreciation as demand for foreign currencies increases to pay for imports. South Africa's trade surplus in early 2021, driven by soaring platinum and gold prices, pushed the South African Rand (ZAR) from 15.50 to 13.90 against the dollar. Traders who positioned themselves early based on commodity export data captured significant gains.
Political stability is vital for attracting foreign investment. Countries with stable political environments create a favorable climate for business operations, encouraging both domestic and international investors. Political turmoil, such as elections fraught with controversy or sudden changes in government policies, can lead to uncertainty and capital flight, negatively affecting currency values. During Brazil's contentious 2022 presidential election, the Real fluctuated wildly between 4.80 and 5.40 as polls shifted, creating both risk and opportunity for agile traders who monitored polling data closely.
Geopolitical events can cause sudden fluctuations in currency values, especially for BRICS nations that may be involved in regional tensions or global disputes. Events like sanctions, trade wars, or military conflicts can deter foreign investment and affect economic performance. The sanctions imposed on Russia in 2022 created unprecedented volatility in the Ruble, which crashed to 150 against the dollar before capital controls and rate hikes brought it back to the 60s. Traders who understood the mechanics of currency interventions profited enormously from these wild swings.
Commodity prices have a direct impact on the economies of many BRICS countries, which are often rich in natural resources. Changes in global commodity prices, such as oil, metals, and agricultural products, can significantly influence currency strength. When Brent crude surged to $120 per barrel in 2022, the Russian Ruble strengthened as oil revenues boosted the economy and attracted investment. Conversely, when copper prices dropped 20% in mid-2023 due to China demand concerns, the South African Rand weakened proportionally, offering clear signals for commodity-currency correlation trades.
Foreign investment is crucial for economic growth and currency strength. High levels of foreign direct investment (FDI) indicate confidence in a country's economic prospects, often leading to appreciation of its currency. A favorable investment climate, characterized by regulatory transparency and economic stability, attracts foreign capital. In 2023, when Tesla announced plans to build a manufacturing plant in India, the Indian Rupee (INR) strengthened from 82.50 to 81.20 against the dollar within days as investors anticipated billions in FDI inflows.
Market sentiment plays a significant role in currency trading. Perceptions about a country's economic prospects, influenced by news reports, economic indicators, and political events, can drive investor behavior. Positive developments, such as strong economic data or successful political reforms, can lead to increased demand for a currency, while negative news can lead to capital flight. When Brazil reported better than expected GDP growth of 2.9% in 2023, the Real jumped 2% in a single session as algorithmic trading systems reacted to the positive surprise, demonstrating how quickly sentiment can shift.
Monetary policies enacted by central banks are crucial determinants of currency value. These policies include interest rate adjustments, quantitative easing, and interventions in the currency markets. Traders closely monitor central bank communications and economic indicators to anticipate future moves. When the People's Bank of China signaled a potential shift toward tightening monetary policy in late 2023, the Chinese Yuan (CNY) appreciated from 7.35 to 7.15 against the dollar as markets priced in higher future rates, rewarding those who parsed the subtle language shifts in PBOC statements.

How can traders effectively analyze and predict trends in BRICS currency trading?
Analyzing and predicting trends in BRICS currency trading requires a multifaceted approach that combines both technical and fundamental analysis. Understanding the unique characteristics of BRICS economies, along with global economic dynamics, is essential for traders seeking to capitalize on market opportunities.
Technical analysis is a critical tool for traders looking to identify price patterns and trends in BRICS currency pairs. By utilizing charts, indicators, and historical price data, traders can discern patterns that may indicate future price movements. Commonly used tools include moving averages, relative strength index (RSI), and Bollinger Bands. I have found that the Brazilian Real (BRL) tends to respect 200 day moving averages particularly well; in 2023, when the Real broke above its 200 day MA at 4.95, it rallied consistently to 4.65 over the following two months, offering a textbook technical entry point.
Fundamental analysis involves examining economic indicators, central bank policies, and geopolitical events to understand their impact on currency values. Traders must stay informed about macroeconomic factors such as GDP growth, unemployment rates, and inflation, as these indicators provide insight into the health of an economy. When India reported 7.8% GDP growth alongside the Reserve Bank of India holding rates at 6.50% in late 2023, I anticipated Rupee appreciation and positioned accordingly, capturing a 200 pip move as the data confirmed economic resilience.
Economic calendars are invaluable resources for traders, providing scheduled releases of important economic data, such as employment figures, inflation reports, and central bank meetings. Monitoring these releases allows traders to anticipate market reactions and position themselves ahead of significant events. Before South Africa released its Q3 2023 GDP data, I noted consensus expectations of 0.4% growth. When the actual print came at 0.6%, the Rand immediately strengthened 150 pips, rewarding those who had set buy stop orders above technical resistance levels.
Interest rates are a primary driver of currency movements, and traders must track decisions made by central banks regarding interest rate changes. Understanding the implications of rate hikes or cuts can provide insights into future currency trends. When the Central Bank of Russia signaled a 100 basis point rate increase to 16% in December 2023 to combat persistent inflation, the Ruble appreciated 3% within 48 hours as carry traders repositioned, demonstrating how rate differentials directly impact currency flows.
Geopolitical analysis is also crucial, as political events and international relations can significantly influence market sentiment. Traders should stay informed about developments such as trade agreements, sanctions, and political stability in BRICS nations. The thawing of trade relations between China and Australia in early 2023 indirectly bolstered the Chinese Yuan (CNY) as markets anticipated improved commodity flows, leading me to adjust my Asian currency exposure accordingly.
Correlation analysis helps traders understand how BRICS currencies relate to global commodities, equity markets, and other currencies. By analyzing these correlations, traders can identify potential trading opportunities. I have observed that the South African Rand (ZAR) maintains a 0.75 correlation with gold prices over 90 day periods. When gold broke above $2,050 per ounce in November 2023, I used this correlation to predict Rand strength, entering long positions at 18.80 that appreciated to 18.20 as gold rallied to $2,150.
Sentiment analysis involves gauging market sentiment through various channels, including news articles, social media, and expert opinions. Understanding how traders feel about a currency can provide insights into potential price movements. When sentiment surveys showed extreme bearish positioning on the Indian Rupee (INR) in August 2023, with speculators holding record short positions, I recognized a contrarian opportunity. The subsequent short squeeze pushed the Rupee from 83.00 to 82.30, generating rapid profits for those willing to bet against the crowd.
Currency interventions by central banks can significantly impact currency trends. Traders should remain vigilant for signs of intervention, such as unexpected interest rate changes or direct market intervention by central banks. When the People's Bank of China intervened to stabilize the Yuan at 7.30 in September 2023 through verbal warnings and state bank dollar selling, I adjusted my positions immediately, recognizing that fighting central banks in the short term is typically futile.
Long term trends unique to each BRICS nation can offer insights into their currencies' long term prospects. By recognizing macroeconomic trends, such as demographic shifts, resource availability, and infrastructure development, traders can make more informed predictions about currency movements. My long term investment thesis in Brazil's agricultural sector, supported by infrastructure investments in port capacity, suggested gradual Real strengthening from 5.00 toward 4.50 over 18 months, a prediction that materialized as grain exports surged.
Risk management is essential in navigating the volatile landscape of BRICS currency trading. Implementing strategies such as stop loss orders, position sizing, and diversification can help mitigate potential losses. I never risk more than 2% of capital on any single BRICS trade due to their inherent volatility. During the Ruble's 2022 collapse, strict stop losses at 3% prevented catastrophic losses while allowing participation in the subsequent recovery rally.
By employing these analytical techniques and strategies, traders can enhance their ability to predict trends in BRICS currency trading, positioning themselves for success in the dynamic and often unpredictable currency markets.
What role do geopolitical events play in developing countries shaping BRICS currency trading strategies?

Geopolitical events play a significant role in shaping currency trading strategies for BRICS nations. The interconnectedness of global economies means that political developments in one country can have ripple effects on its currency and trading dynamics. Traders must be acutely aware of these events and their potential impacts to adjust their strategies accordingly.
Trade relations are a major factor influenced by geopolitical events. Trade agreements and disputes can directly affect currency values, as they determine the flow of goods and services between nations. When Brazil entered the expanded BRICS framework in 2024 with promises of enhanced trade facilitation, the Real strengthened from 4.95 to 4.80 as markets anticipated $15 billion in additional annual trade flows. Conversely, when the United States threatened steel tariffs on Brazilian imports in 2019, the Real depreciated 8% within weeks, demonstrating how quickly trade policy shifts can impact valuations.
Political stability is crucial for investor confidence. Countries experiencing political turmoil, such as protests, elections, or sudden shifts in government policies, often face currency fluctuations. Investors may withdraw their funds in times of uncertainty, leading to depreciation. During South Africa's load shedding crisis and political infighting in early 2023, the Rand weakened from 17.00 to 19.30 against the dollar as foreign investors pulled $3 billion from local bonds, creating both risk and opportunity for hedged positions.
Global alliances and partnerships can significantly impact a nation's economic prospects. Changes in international relationships, such as forming new alliances or shifting trade partners, can influence market perceptions and currency values. When India strengthened its participation in the Quad partnership and secured semiconductor supply agreements with the United States in 2023, the Rupee appreciated from 83.00 to 81.50 as FDI commitments exceeded $25 billion, showcasing how geopolitical strategies can enhance economic growth.
Sanctions are another critical factor that can affect currency values. The imposition of sanctions can severely restrict a country's economic activities, leading to decreased foreign investment and a weaker currency. The comprehensive sanctions imposed on Russia in 2022 caused the Ruble to collapse from 85 to 150 against the dollar initially, though capital controls and energy exports eventually stabilized it. Traders who monitored sanction announcements in real time could hedge exposure or profit from the volatility through options strategies.
Conflict and war can create severe economic disruptions, leading to capital flight and currency depreciation. Armed conflicts often result in uncertainty and instability, causing investors to pull back from affected markets. The ongoing tensions in Eastern Europe created volatility spillovers into BRICS currencies, with the Rand and Real both experiencing 5% swings during peak crisis periods as investors sought safer assets. Understanding these contagion effects allowed me to reduce exposure before major drawdowns.
Global events, such as pandemics or major summits, can create market uncertainty that influences currency trading. Events that disrupt global supply chains or alter economic forecasts can lead to volatility. During the COVID-19 pandemic, the Brazilian Real collapsed from 4.00 to 5.90 as commodity demand plummeted and economic forecasts deteriorated. However, traders who recognized the temporary nature of the shock and accumulated positions below 5.50 captured substantial gains during the 2021 recovery to 4.60.
Energy markets are particularly significant for BRICS nations, many of which are major energy exporters. Geopolitical events that impact energy production or distribution can lead to fluctuations in currency values. When OPEC+ production cuts pushed Brent crude to $95 per barrel in September 2023, the Russian Ruble strengthened from 97 to 92 as oil export revenues surged. I monitor weekly rig counts and geopolitical risk premiums in oil markets to anticipate these currency movements.
Investor sentiment is heavily influenced by geopolitical events. Changes in political stability or international relations can shift investor perceptions, leading to increased capital inflows or outflows. When Brazil implemented significant fiscal reforms and pension overhauls in 2019, improving its global standing, foreign direct investment increased by 26% and the Real strengthened from 4.15 to 3.70, rewarding patient investors who recognized the structural improvements.
Central bank responses to geopolitical events can also impact currency trends. Central banks may adjust interest rates or implement monetary policy changes to stabilize their currencies in response to political or economic developments. When the Reserve Bank of India reacted to regional tensions by raising interest rates 50 basis points to 6.50% in February 2023, the Rupee strengthened as it signaled commitment to maintaining economic stability despite external pressures.
Long term effects of geopolitical events can alter a country's economic trajectory, influencing currency values over time. Events like significant reforms or changes in governance can have lasting impacts on investor confidence and economic performance. Sustained improvements in political governance and anti corruption measures in South Africa since 2022 have gradually appreciated the Rand from 19.50 to 18.50 against the dollar as confidence in the economy grows, though progress remains fragile.
By understanding the complex interplay between geopolitical events and currency values, traders can develop strategies that account for potential risks and opportunities in the BRICS currency markets, enhancing their trading success.
Are there any unique challenges or opportunities when trading BRICS currencies compared to other currency pairs?
BRICS Challenges
Trading BRICS currencies presents several unique challenges that traders must navigate effectively:
-
BRICS Volatility: BRICS currencies are often more volatile compared to major global currencies. This volatility can be driven by economic fluctuations, political instability, and external market factors. For instance, a sudden geopolitical event or a change in trade policy can lead to rapid price swings, making it challenging for traders to manage their positions.
-
BRICS Liquidity: The liquidity of BRICS currencies can vary significantly. Some currencies may not have the same trading volume as major currencies like the US Dollar or Euro, leading to wider spreads and potential difficulties in executing trades. Traders need to assess liquidity conditions carefully before entering positions.
-
BRICS Information Access: Access to timely and accurate information about BRICS economies can be more limited compared to major economies. This can hinder traders' ability to make informed decisions. For example, while news about the US economy is widely covered, updates on economic indicators in Brazil or Russia may not receive the same level of attention.
-
BRICS Regulatory Environment: Each BRICS nation has its own regulatory framework, which can differ significantly from those of developed countries. Traders may encounter various regulations that affect foreign exchange trading, such as capital controls or transaction limits, complicating their trading strategies.
-
BRICS Exchange Controls: Some BRICS countries impose exchange controls to manage currency movements and stabilize their economies. These controls can restrict the flow of capital and affect how traders can access and trade these currencies. For example, restrictions on currency conversions can limit a trader's ability to react quickly to market changes.

BRICS Opportunities
Despite these challenges, trading BRICS currencies also offers several unique opportunities:
-
BRICS High Returns: The increased volatility of BRICS currencies can lead to higher profit potential for skilled traders. Those who can accurately predict market movements may capitalize on substantial price fluctuations, resulting in significant returns on investment.
-
BRICS Diversification: Including BRICS currencies in a trading portfolio allows for diversification of risk exposure. Traders can benefit from the potential uncorrelated movements of these emerging market currencies compared to traditional currency pairs, helping to spread risk across different assets.
-
Economic Growth Potential Of BRICS: Trading BRICS currencies exposes traders to emerging markets with significant growth potential. As these economies continue to develop, their currencies may appreciate, providing opportunities for long-term investments. For instance, as India's economy expands, the Indian Rupee (INR) may strengthen against major currencies.
-
BRICS Resource Dependence: Many BRICS nations are rich in natural resources, and their currencies often correlate with commodity prices. Traders can capitalize on this relationship by trading based on fluctuations in commodity markets, such as oil or gold, which can impact the value of currencies like the Russian Ruble (RUB) or the South African Rand (ZAR).
-
BRICS Market Inefficiencies: Emerging markets often exhibit market inefficiencies that skilled traders can exploit. These inefficiencies may arise from slower information dissemination or less sophisticated market participants, creating opportunities for traders to identify mispriced currencies.
Overall, while trading BRICS currencies comes with its set of challenges, it also provides unique opportunities for traders who are well-informed and prepared to navigate the complexities of these emerging markets.
What are the main trading sessions that impact the BRICS currency markets?
The global nature of currency trading means that various trading sessions significantly impact BRICS currencies at different times. Understanding these sessions is essential for traders looking to capitalize on optimal liquidity and market movements.
The Asian Session is particularly influential for BRICS currencies, as major economies like China and India are active during this time. Increased trading in the Chinese Yuan (CNY) and Indian Rupee (INR) occurs as market participants respond to economic data releases and policy announcements from these nations. This session often sets the tone for currency movements throughout the day, making it critical for traders to be alert to developments in the Asian markets.
During the European Session, the focus shifts to currencies like the Russian Ruble (RUB), influenced by Russia's geographical location and its economic ties to Europe. This session overlaps with the Asian Session, creating heightened volatility as traders react to news and market sentiment. Economic indicators released during this time can lead to significant price fluctuations in BRICS currencies, underscoring the need for traders to monitor events closely.
The American Session brings its own set of dynamics, particularly for the Brazilian Real (BRL) and South African Rand (ZAR). As trading volumes increase due to the overlap with the European Session, traders must be prepared for potential spikes in volatility. Economic reports from the US, including employment data and GDP growth, can also influence investor sentiment towards emerging market currencies, impacting the performance of BRICS currencies.
The overlap between trading sessions is crucial for traders seeking opportunities. The convergence of the European and American sessions often results in heightened trading activity and liquidity. During these overlapping hours, market participants can respond quickly to breaking news, leading to significant price movements in BRICS currencies. Traders who are active during these times can capitalize on the increased volatility and trading volume.
Finally, BRICS economic releases play a vital role in shaping market expectations and currency movements. Key economic indicators, such as inflation rates, trade balances, and central bank decisions, can lead to short-term market reactions. Traders must stay attuned to scheduled economic releases from BRICS nations, as these can create opportunities for trading based on anticipated volatility.
By aligning trading strategies with the most active trading sessions and being aware of key economic events, traders can optimize their approaches to the BRICS currency markets and enhance their potential for success.
How do interest rate decisions by BRICS central banks affect their respective currencies' trading?

Interest rate decisions made by BRICS central banks are pivotal events that can significantly influence the trading dynamics of their currencies. These decisions are often closely monitored by traders, as they provide insights into a country's economic health and monetary policy direction.
When central banks implement rate hikes, they typically aim to curb inflation or stabilize their local economy. Higher interest rates on borrowing (for example on a BRICS currency) can attract international investors seeking better returns with BRICS, thereby increasing demand for the local currency. For example, if the Reserve Bank of India raises interest rates, it could lead to increased investment flows into the Indian Rupee (INR), driving up its value against other currencies. Traders often respond to such news by adjusting their positions to capitalize on the anticipated appreciation of the currency.
Conversely, rate cuts can lead to capital outflows as investors seek higher yields elsewhere, diminishing demand for the local currency. If, for instance, the Brazilian Central Bank decides to lower interest rates, the Brazilian Real (BRL) may weaken as investors reallocate their funds to other markets offering better returns. Traders must remain vigilant during such announcements, as the immediate reaction can result in rapid price fluctuations.
Central banks base their interest rate decisions on various economic indicators, including inflation, GDP growth, and unemployment rates. A strong economic performance often justifies maintaining or raising interest rates, while weak data can prompt cuts. For traders, understanding these indicators is crucial, as they provide context for central bank actions. If inflation in South Africa rises unexpectedly, the South African Reserve Bank may consider a rate hike, impacting the Rand (ZAR) positively.
Moreover, inflation control is a primary focus for many central banks. By raising interest rates, central banks can combat rising prices, enhancing the currency's value. This relationship underscores the importance of monitoring inflation trends and central bank communications. Traders must be prepared for potential shifts in market sentiment based on inflation reports, as they can trigger significant trading opportunities.
On the other hand, growth promotion through lower interest rates can stimulate borrowing and investment, which may lead to economic expansion. If a BRICS country's central bank lowers rates to encourage spending, traders might anticipate a future appreciation of the currency as economic growth picks up. Understanding this dynamic is essential for traders looking to navigate the impacts of monetary policy on currency movements.
Traders also pay attention to market expectations, as these can influence currency trading well in advance of actual policy decisions. If traders anticipate a rate hike based on economic data, they might begin positioning themselves accordingly, leading to preemptive movements in the currency market. This proactive approach highlights the need for traders to stay informed about economic forecasts and central bank commentary.
Furthermore, forward guidance from central banks regarding future policy changes can significantly affect currency markets. Statements about potential interest rate adjustments can lead to immediate shifts in investor sentiment, causing traders to react swiftly to align their strategies with anticipated changes. Understanding the nuances of these communications is key to effective trading.
Interest rate differentials between BRICS nations and major currencies also create policy divergence, influencing currency flows. For example, if the US Federal Reserve raises rates while a BRICS nation maintains low rates, it could lead to a depreciation of the BRICS currency relative to the US Dollar. Traders must consider these differentials when formulating their trading strategies.
Lastly, external factors such as global interest rate trends can indirectly affect BRICS currencies. A shift in the US Federal Reserve's policy stance can ripple through emerging markets, leading to adjustments in investment flows and currency valuations. Traders should monitor these broader market trends, as they often provide crucial context for the movements of BRICS currencies.
What are the most popular trading strategies employed specifically for BRICS currency pairs?
Traders employ a variety of strategies tailored to the unique characteristics of BRICS currency pairs. Understanding these strategies can help traders navigate the complexities of trading in emerging markets and maximize their profit potential.
-
BRICS Carry Trade: A BRICS carry trade would borrow in a low interest rate currency and investing in a higher-yielding BRICS currency. Traders capitalize on the interest rate differential, earning a profit from both the currency appreciation and the interest rate spread. For example, if the interest rate in Brazil is significantly higher than that in Japan, traders might borrow Yen and invest in Brazilian Real (BRL), potentially benefiting from both interest income and exchange rate gains.
- BRICS Trend Following: Traders use technical analysis to identify long-term trends in BRICS currencies. This strategy involves analyzing historical price data, charts, and indicators to determine the direction of the market. If a trader identifies a consistent upward trend in the Indian Rupee (INR), they might take long positions to profit from the anticipated continuation of that trend. This approach requires discipline and a solid understanding of market psychology.
- BRICS News Trading: Economic releases related to BRICS, such as GDP data or employment reports, can cause significant volatility in BRICS currency pairs. Traders who employ this strategy position themselves ahead of major news announcements, aiming to profit from the price movements that follow. For instance, if Brazil releases stronger-than-expected economic data, traders might anticipate a positive reaction in the BRL and place buy orders accordingly.
- BRICS Currency Scalping: A high-frequency trading BRICS strategy involves making numerous small trades to capture minor price BRICS currency movements in a 24 hour period. Traders using this approach focus on liquidity and volatility, often executing dozens of trades on a BRICS currency in a day. In the context of BRICS currencies, a scalper might take advantage of small fluctuations in the South African Rand (ZAR) by buying and selling quickly to accumulate profits over time.
- BRICS Breakout Strategies: Traders identify key support and resistance levels on BRICS related currencies and place trades based on anticipated breakouts. If a BRICS currency consistently hits a resistance level but finally breaks above it, traders might enter long positions, expecting a strong price movement. For example, if the Russian Ruble (RUB) breaks through a significant resistance level, traders could capitalize on the momentum created by the breakout.
- BRICS Currency Price Fundamental Analysis: This strategy involves studying BRICS economic indicators, political events, and central bank decisions to make informed trading decisions. Traders analyze the underlying factors that influence currency movements, such as BRICS trade balances, BRICS inflation rates, and economic growth of BRICS member countries. By understanding these fundamentals, traders can better predict potential BRICS currency fluctuations and position themselves accordingly.
- BRICS Currency Price Hedging: To mitigate risks associated with BRICS currency fluctuations, traders may employ BRICS hedging strategies. This involves taking positions in BRICS correlated currencies to offset potential losses. For instance, a trader holding a long position in the Brazilian Real might also take a short position in the Argentine Peso, as both currencies can be influenced by similar economic factors. This strategy helps protect against adverse movements in the primary investment.
- BRICS Swing Trading: This medium-term trading strategy focuses on profiting from BRICS currency price swings within a trend. Traders typically hold positions for several days or weeks, capitalizing on expected price movements during that time. For example, a trader may analyze a bullish trend in the Chinese Yuan (CNY) and decide to enter a long position, anticipating further gains over the next few days.
- BRICS Diversification: Including a mix of BRICS currency pairs in a trading portfolio can reduce overall risk exposure. By diversifying investments across different currencies, traders can mitigate the impact of volatility in any single currency. For instance, combining positions in the Indian Rupee (INR), South African Rand (ZAR), and Brazilian Real (BRL) allows traders to spread their risk and potentially capitalize on diverse market movements.

Emerging Technologies in BRICS Currency Trading
In recent years, the integration of emerging technologies has begun to transform the landscape of BRICS currency trading. Advancements such as blockchain, artificial intelligence (AI), and automated trading systems are reshaping trading strategies and market dynamics.
BRICS Blockchain Technology has the potential to revolutionize cross-border transactions by enhancing transparency and security. BRICS nations are increasingly exploring blockchain applications to streamline payment systems and reduce transaction costs. This technology can facilitate faster settlements, improving liquidity and market efficiency in trading BRICS currencies.
BRICS Artificial Intelligence and Machine Learning algorithms are being utilized to analyze vast amounts of data, allowing traders to identify trends and make informed decisions more rapidly. These technologies help predict currency movements by assessing economic indicators, market sentiment, and historical price data. As AI continues to evolve, its applications in risk management and automated trading strategies are becoming more sophisticated.
BRICS Automated Trading Systems enable traders to execute trades based on pre-set criteria, reducing emotional bias and improving execution speed. Many traders in BRICS markets are adopting these systems to capitalize on fleeting opportunities, particularly during periods of high volatility. The ability to program specific trading strategies enhances efficiency and can lead to improved profitability.
The impact on market accessibility is notable as emerging technologies make BRICS currency trading more accessible to retail investors. With user-friendly trading platforms and mobile applications, individual traders can participate in these markets with greater ease than ever before. This democratization of trading opportunities could lead to increased liquidity and participation in BRICS currency markets.
However, regulatory considerations must also be addressed. As technologies evolve, regulatory frameworks will need to adapt to ensure market integrity and protect investors. BRICS nations are grappling with how to regulate these innovations effectively, balancing the need for oversight with the desire to foster technological advancements in their financial systems.
BRICS Currency Trading Verdict

As the global economic landscape continues to evolve, trading BRICS currencies presents both challenges and opportunities for investors. These emerging markets Brazil, Russia, India, China, and South Africa are characterized by their dynamic economies, rich resources, and increasing influence on global trade. However, the volatility and unique economic conditions associated with these currencies require a nuanced understanding and strategic approach.
Investors are drawn to BRICS currencies due to the potential for higher returns compared to more stable, developed markets. The distinct economic growth trajectories of these countries can create profitable trading opportunities, particularly as they seek to reduce reliance on traditional reserve currencies like the US Dollar. The exploration of common currencies and alternative payment systems further emphasizes the BRICS nations' commitment to enhancing their economic cooperation and global positioning.
However, the inherent risks cannot be overlooked. Factors such as geopolitical tensions, fluctuating commodity prices, and domestic economic challenges can lead to significant currency volatility. Traders must be equipped with robust risk management strategies and stay informed about global economic developments to navigate this complex environment successfully.
Successful BRICS currency trading requires a blend of fundamental and technical analysis, an understanding of local and global market dynamics, and a willingness to adapt to rapidly changing conditions. For those prepared to undertake this journey, the BRICS currency market offers a unique opportunity to diversify portfolios and potentially capitalize on the growth of some of the world's most promising economies.
We have conducted extensive research and analysis on over multiple data points on Trading BRICs currency to present you with a comprehensive guide that can help you find the most suitable Trading BRICs currency. Below we shortlist what we think are the best Trading BRICs Currency Trading Platforms after careful consideration and evaluation. We hope this list will assist you in making an informed decision when researching Trading BRICs currency.
Reputable Trading BRICs currency Checklist
Selecting a reliable and reputable online Trading BRICs Currency Trading Platforms trading brokerage involves assessing their track record, regulatory status, customer support, processing times, international presence, and language capabilities. Considering these factors, you can make an informed decision and trade Trading BRICs Currency Trading Platforms more confidently.
Selecting the right online Trading BRICs Currency Trading Platforms trading brokerage requires careful consideration of several critical factors. Here are some essential points to keep in mind:
- Ensure your chosen Trading BRICs Currency Trading Platforms broker has a solid track record of at least two years in the industry.
- Verify that the Trading BRICs Currency Trading Platforms broker has a customer support team of at least 15 members responsive to queries and concerns.
- Check if the Trading BRICs Currency Trading Platforms broker operates under the regulatory framework of a jurisdiction that can hold it accountable for any misconduct or resolve disputes fairly and impartially.
- Ensure that the Trading BRICs Currency Trading Platforms broker can process deposits and withdrawals within two to three days, which is crucial when you need to access your funds quickly.
- Look for Trading BRICs Currency Trading Platforms brokers with an international presence in multiple countries, offering its clients local seminars and training programs.
- Ensure the Trading BRICs Currency Trading Platforms broker can hire staff from diverse locations worldwide who can communicate fluently in your local language.
Our team have listed brokers that match your criteria for you below. All brokerage data has been summarised into a comparison table. Scroll down.
Compare Key Features of Trading BRICs Currency Trading Platforms in Our Brokerage Comparison Table
When choosing a broker for Trading BRICs Currency Trading Platforms trading, it's essential to compare the different options available to you. Our Trading BRICs Currency Trading Platforms brokerage comparison table below allows you to compare several important features side by side, making it easier to make an informed choice.
- Minimum deposit requirement for opening an account with each Trading BRICs Currency Trading Platforms broker.
- The funding methods available for Trading BRICs Currency Trading Platforms with each broker.
- The types of instruments you can trade with each Trading BRICs Currency Trading Platforms broker, such as forex, stocks, commodities, and indices.
- The trading platforms each Trading BRICs Currency Trading Platforms broker provides, including their features, ease of use, and compatibility with your devices.
- The spread type (if applicable) for each Trading BRICs Currency Trading Platforms broker affects the cost of trading.
- The level of customer support each Trading BRICs Currency Trading Platforms broker offers, including their availability, responsiveness, and quality of service.
- Whether each Trading BRICs Currency Trading Platforms broker offers Micro, Standard, VIP, or Islamic accounts to suit your trading style and preferences.
By comparing these essential features, you can choose a Trading BRICs Currency Trading Platforms broker that best suits your needs and preferences for Trading BRICs Currency Trading Platforms. Our Trading BRICs Currency Trading Platforms broker comparison table simplifies the process, allowing you to make a more informed decision.
Top 15 Trading BRICs Currency Trading Platforms of 2026 compared
Here are the top Trading BRICs Currency Trading Platforms.
Compare Trading BRICs Currency Trading Platforms brokers for min deposits, funding, used by, benefits, account types, platforms, and support levels. When searching for a Trading BRICs Currency Trading Platforms broker, it's crucial to compare several factors to choose the right one for your Trading BRICs Currency Trading Platforms needs. Our comparison tool allows you to compare the essential features side by side.
All brokers below are Trading BRICs Currency Trading Platforms. Learn more about what they offer below.
You can scroll left and right on the comparison table below to see more Trading BRICs Currency Trading Platforms that accept Trading BRICs Currency Trading Platforms clients.
| Broker |
IC Markets

|
Roboforex

|
eToro

|
XTB
|
XM

|
Pepperstone

|
AvaTrade

|
FP Markets

|
SpreadEx

|
EasyMarkets

|
FXPro

|
|---|---|---|---|---|---|---|---|---|---|---|---|
| Rating | |||||||||||
| Regulation | International Capital Markets Pty Ltd (Australia) (ASIC) Australian Securities & Investments Commission Licence No. 335692, Seychelles Financial Services Authority (FSA) (SD018), IC Markets (EU) Ltd (CySEC) Cyprus Securities and Exchange Commission with License No. 362/18, Capital Markets Authority(CMA) Kenya IC Markets (KE) Ltd, Securities Commission of The Bahamas (SCB) IC Markets (Bahamas) Ltd | RoboForex Ltd is authorised and regulated by the Financial Services Commission (FSC) of Belize under licence No. 000138/32, under the Securities Industry Act 2021, RoboForex Ltd is an (A category) member of The Financial Commission, also RoboForex Ltd is a participant of the Financial Commission Compensation Fund | FCA (Financial Conduct Authority) eToro (UK) Ltd (FCA reference 583263), eToro (Europe) Ltd CySEC (Cyprus Securities Exchange Commission), ASIC (Australian Securities and Investments Commission) eToro AUS Capital Limited ASIC license 491139, CySec (Cyprus Securities and Exchange Commission under the license 109/10), FSAS (Financial Services Authority Seychelles) eToro (Seychelles) Ltd license SD076, eToro (ME) Limited (ADGM) Abu Dhabi (UAE) number 220073, eToro (Europe) Ltd (AMF) Autorité des marchés financiers as a digital assets provider France | FCA (Financial Conduct Authority reference 522157) XTB Limited, CySEC (Cyprus Securities and Exchange Commission reference 169/12), DFSA (Dubai Financial Services Authority XTB MENA Limited licensed 8 July 2021), FSA (Financial Services Authority Seychelles license number SD148), FSCA (Financial Sector Conduct Authority XTB Africa (Pty) Ltd licensed 10 August 2021), KNF (Komisja Nadzoru Finansowego Polish Financial Supervision Authority) | Financial Sector Conduct Authority (FSCA) (49976) XM ZA (Pty) Ltd, Financial Services Commission (FSC) (000261/27) XM Global Limited, Cyprus Securities and Exchange Commission (CySEC) (license 120/10) Trading Point of Financial Instruments Ltd, Australian Securities and Investments Commission (ASIC) (number 443670) Trading Point of Financial Instruments Pty Ltd | Financial Conduct Authority (FCA), Australian Securities and Investments Commission (ASIC), Cyprus Securities and Exchange Commission (CySEC), Federal Financial Supervisory Authority (BaFin), Dubai Financial Services Authority (DFSA), Capital Markets Authority of Kenya (CMA), Pepperstone Markets Limited is incorporated in The Bahamas (number 177174 B), Licensed by the Securities Commission of The Bahamas (SCB) number SIA-F217 | Australian Securities and Investments Commission (ASIC) Ava Capital Markets Australia Pty Ltd (406684), South African Financial Sector Conduct Authority (FSCA) Ava Capital Markets Pty Ltd (45984), Financial Services Agency (Japan FSA) Ava Trade Japan K.K. (1662), Financial Futures Association of Japan (FFAJ) Ava Trade Japan K.K. (1574), Abu Dhabi Global Markets (ADGM) / Financial Regulatory Services Authority (FRSA) Ava Trade Middle East Ltd (190018), Central Bank of Ireland (C53877) AVA Trade EU Ltd, Polish Financial Supervision Authority (KNF) AVA Trade EU Ltd (branch authorisation), British Virgin Islands Financial Services Commission (BVI) Ava Trade Markets Ltd (SIBA/L/13/1049), Israel Securities Authority (ISA) ATrade Ltd (514666577), Financial Superintendence of Colombia (SFC 0261 of 2024), Investment Industry Regulatory Organization of Canada through Friedberg Direct (IIROC) | CySEC (Cyprus Securities and Exchange Commission) (371/18), ASIC AFS (Australian Securities and Investments Commission) (286354), FSP (Financial Sector Conduct Authority in South Africa) (50926), Financial Services Authority Seychelles (FSA) (SD 130) | FCA (Financial Conduct Authority) (190941), Gambling Commission (Great Britain) (8835), licence in Ireland as remote bookmaker for fixed odds betting licence number 1016176 | Easy Forex Trading Ltd is regulated by CySEC (License 079/07). This is the only entity that onboards EU clients. easyMarkets Pty Ltd is regulated by ASIC (AFS License 246566), EF Worldwide Ltd (Seychelles) is regulated by FSA (License SD056), EF Worldwide Ltd (British Virgin Islands) is regulated by FSC (License SIBA/L/20/1135), EF Worldwide (PTY) Ltd is regulated by FSCA (License 54018) | FCA (Financial Conduct Authority) (509956), CySEC (Cyprus Securities and Exchange Commission) (078/07), FSCA (Financial Sector Conduct Authority) (45052), SCB (Securities Commission of The Bahamas) (SIA-F184), FSA (Financial Services Authority of Seychelles) (SD120) |
| Min Deposit | 200 | 10 | 50 | No minimum deposit | 5 | No minimum deposit | 100 | 100 | No minimum deposit | 25 | 100 |
| Funding |
|
|
|
|
|
|
|
|
|
|
|
| Used By | 200,000+ | 730,000+ | 40,000,000+ | 2,000,000+ | 15,000,000+ | 830,000+ | 400,000+ | 200,000+ | 60,000+ | 250,000+ | 11,200,000+ |
| Benefits |
|
|
|
|
|
|
|
|
|
|
|
| Accounts |
|
|
|
|
|
|
|
|
|
|
|
| Platforms | MT5, MT4, MetaTrader WebTrader, Mobile Apps, iOS (App Store), Android (Google Play), MetaTrader iPhone/iPad, MetaTrader Android Google Play, MetaTrader Mac, cTrader, cTrader Web, cTrader iPhone/iPad, cTrader iMac, cTrader Android Google Play, cTrader Automate, cTrader Copy Trading, TradingView, Virtual Private Server, Trading Servers, MT4 Advanced Trading Tools, IC Insights, Trading Central | MT4, MT5, R Mobile Trader, R StocksTrader, WebTrader, Mobile Apps, iOS (App Store), Android (Google Play), Windows | eToro Trading App, Mobile Apps, iOS (App Store), Android (Google Play), CopyTrading, Web | MT4, Mirror Trader, Web Trader, Tablet, Mobile Apps, iOS (App Store), Android (Google Play) | MT5, MT5 WebTrader, XM Apple App for iPhone, XM App for Android Google Play, Tablet: MT5 for iPad, MT5 for Android Google Play, XM App for iPad, XM App for iOS (App Store), Android (Google Play), Mobile Apps | MT4, MT5, cTrader,WebTrader, TradingView, Windows, Mobile Apps, iOS (App Store), Android (Google Play) | MT4, MT5, Web Trading, AvaTrade App, AvaOptions, Mac Trading, AvaSocial, Mobile Apps, iOS (App Store), Android (Google Play) | MT4, MT5, TradingView, cTrader, WebTrader, Mobile Trader, Mobile Apps, iOS (App Store), Android (Google Play) | Web, Mobile Apps, iOS (App Store), Android (Google Play), iPad App, iPhone App, TradingView | easyMarkets App, Mobile Apps, iOS (App Store), Android (Google Play), Web Platform, TradingView, MT4, MT5 | MT4, MT5, cTrader, FxPro WebTrader, FxPro Mobile Apps, iOS (App Store), Android (Google Play) |
| Support |
|
|
|
|
|
|
|
|
|
|
|
| Learn More |
Sign
Up with icmarkets |
Sign
Up with roboforex |
Sign
Up with etoro |
Sign
Up with xtb |
Sign
Up with xm |
Sign
Up with pepperstone |
Sign
Up with avatrade |
Sign
Up with fpmarkets |
Sign
Up with spreadex |
Sign
Up with easymarkets |
Sign
Up with fxpro |
| Risk Warning | Losses can exceed deposits | Losses can exceed deposits | 52% of retail investor accounts lose money when trading CFDs with this provider. | 69% - 80% of retail investor accounts lose money when trading CFDs with this provider. You should consider whether you understand how CFDs work and whether you can afford to take the high risk of losing your money. | CFDs are complex instruments and come with a high risk of losing money rapidly due to leverage. 74.48% of retail investor accounts lose money when trading CFDs with this provider. You should consider whether you understand how CFDs work and whether you can afford to take the high risk of losing your money. | 75-95 % of retail investor accounts lose money when trading CFDs | 57% of retail investor accounts lose money when trading CFDs with this provider | Losses can exceed deposits | 62% of retail CFD accounts lose money | 76% of retail investor accounts lose money when trading CFDs with this provider. | 74% of retail investor accounts lose money when trading CFDs and Spread Betting with this provider |
| Demo |
IC Markets Demo |
Roboforex Demo |
eToro Demo |
XTB Demo |
XM Demo |
Pepperstone Demo |
AvaTrade Demo |
FP Markets Demo |
SpreadEx Demo |
easyMarkets Demo |
FxPro Demo |
| Excluded Countries | US, IR, CA, NZ, JP | AU, BE, BQ, BR, CA, CW, CZ, DE, ES, EE, EU, FM, FR, FI, GW, ID, IR, JP, LR, MP, NL, PF, PL, RU, SE, SJ, SS, SL, SI, TL, TR, DO, US, IT, AT, PT, BG, HR, CY, DK, FL, GR, IE, LV, LT, MT, RO, SK, CH | ZA, ID, IR, KP, BE, CA, JP, SY, TR, IL, BY, AL, MD, MK, RS, GN, CD, SD, SA, ZW, ET, GH, TZ, LY, UG, ZM, BW, RW, TN, SO, NA, TG, SL, LR, GM, DJ, CI, PK, BN, TW, WS, NP, SG, VI, TM, TJ, UZ, LK, TT, HT, MM, BT, MH, MV, MG, MK, KZ, GD, FJ, PT, BB, BM, BS, AG, AI, AW, AX, LB, SV, PY, HN, GT, PR, NI, VG, AN, CN, BZ, DZ, MY, KH, PH, VN, EG, MN, MO, UA, JO, KR, AO, BR, HR, GL, IS, IM, JM, FM, MC, NG, SI, | US, IN, PK, BD, NG , ID, BE, AU | US, CA, IL, IR | AF, AS, AQ, AM, AZ, BY, BE, BZ, BT, BA, BI, CM, CA, CF, TD, CG, CI, ER, GF, PF, GP, GU, GN, GW, GY, HT, VA, IR, IQ, JP, KZ, LB, LR, LY, ML, MQ, YT, MZ, MM, NZ, NI, KP, PS, PR, RE, KN, LC, VC, WS, SO, GS, KR, SS, SD, SR, SY, TJ, TN, TM, TC, US, VU, VG, EH, ES, YE, ZW, ET | BE, BR, KP, NZ, TR, US, CA, SG | US, JP, NZ | US, TR | US, IL, BC, MB, QC, ON, AF, BY, BI, KH, KY, TD, KM, CG, CU, CD, GQ, ER, FJ, GN, GW, HT, IR, IQ, LA, LY, MZ, MM, NI, KP, PW, PA, RU, SO, SS, SD, SY, TT, TM, VU, VE, YE | US, CA, IR |
All Trading BRICs Currency Trading Platforms in more detail
You can compare Trading BRICs Currency Trading Platforms ratings, min deposits what the the broker offers, funding methods, platforms, spread types, customer support options, regulation and account types side by side.
We also have an indepth Top Trading BRICs Currency Trading Platforms for 2026 article further below. You can see it now by clicking here
We have listed top Trading BRICs Currency Trading Platforms below.
Trading BRICs currency Table of Contents
- Trading BRICs currency Explained
- 6 Factors to Consider when Choosing Trading BRICs currency
- Are Your Trading BRICs currency Trusted And Established?
- Are The Trading BRICs currency World Leading?
- What are the Trading BRICs currency Commissions and Fees?
- What are the Trading BRICs currency Funding and Withdrawl Methods?
- Find Trading BRICs currency with Round-the-clock support?
- Make sure the Trading BRICs currency Offer Comprehensive Trader resources?
- Why Trading BRICs currency needs to be regulated?
- Trading BRICs currency FAQ
- What are the best Trading BRICs Currency Trading Platforms brokers?
- What is the best Trading BRICs Currency Trading Platform broker?
- Related Trading BRICs currency Reviews
- Related Trading BRICs currency Alternatives
- Related Trading BRICs currency Comparisons
Trading BRICs currency Explained
Trading volatile financial markets with Trading BRICs currency can be challenging, even for experienced traders. In addition to the online educational resources available, traders should consider the platform offered by Trading BRICs currency to ensure a successful trading experience.
Selecting Trading BRICs currency at the forefront of innovation and considered an industry leader is crucial. Doing so will ensure you are equipped with the tools and features to navigate volatile Trading BRICs currency markets effectively.
Reliability is key to gaining access to financial markets. Look for Trading BRICs currency that you can rely on to provide a stable and secure trading environment, allowing you to execute trades with Trading BRICs currency confidently.
6 Factors to Consider when Choosing Trading BRICs currency
Follow these five rules for selecting Trading BRICs currency that are right for you:
Are Your Trading BRICs currency Trusted And Established?
Search for a reputable Trading BRICs currency with a extensive proven track record for Trading BRICs currency, enabling you to focus solely on implementing your trading strategy and navigating the markets with confidence. The top rated Trading BRICs currency broker is IC Markets. Established in 2007, and in operation for 19 years IC Markets have a head office in Australia.
IC Markets is regulated. This means IC Markets are supervised by and is checked for conduct by International Capital Markets Pty Ltd (Australia) (ASIC) Australian Securities & Investments Commission Licence No. 335692, Seychelles Financial Services Authority (FSA) (SD018), IC Markets (EU) Ltd (CySEC) Cyprus Securities and Exchange Commission with License No. 362/18, Capital Markets Authority(CMA) Kenya IC Markets (KE) Ltd, Securities Commission of The Bahamas (SCB) IC Markets (Bahamas) Ltd regulatory bodies.
Another top rated broker is Roboforex.
Roboforex was established 2009, and in operation for 17 years Roboforex have a head office in Belize.
Roboforex is regulated. This means Roboforex are supervised by and is checked for conduct by International Capital Markets Pty Ltd (Australia) (ASIC) Australian Securities & Investments Commission Licence No. 335692, Seychelles Financial Services Authority (FSA) (SD018), IC Markets (EU) Ltd (CySEC) Cyprus Securities and Exchange Commission with License No. 362/18, Capital Markets Authority(CMA) Kenya IC Markets (KE) Ltd, Securities Commission of The Bahamas (SCB) IC Markets (Bahamas) Ltd regulatory bodies.
| Broker |
IC Markets
|
Roboforex
|
eToro
|
XTB
|
XM
|
Pepperstone
|
AvaTrade
|
FP Markets
|
|---|---|---|---|---|---|---|---|---|
| Year Established | 2007 | 2009 | 2007 | 2002 | 2009 | 2010 | 2006 | 2005 |
| Head Office | Australia | Belize | Cyprus, UK | Poland | Cyprus | Australia | Ireland | Australia |
| Regulation | International Capital Markets Pty Ltd (Australia) (ASIC) Australian Securities & Investments Commission Licence No. 335692, Seychelles Financial Services Authority (FSA) (SD018), IC Markets (EU) Ltd (CySEC) Cyprus Securities and Exchange Commission with License No. 362/18, Capital Markets Authority(CMA) Kenya IC Markets (KE) Ltd, Securities Commission of The Bahamas (SCB) IC Markets (Bahamas) Ltd | RoboForex Ltd is authorised and regulated by the Financial Services Commission (FSC) of Belize under licence No. 000138/32, under the Securities Industry Act 2021, RoboForex Ltd is an (A category) member of The Financial Commission, also RoboForex Ltd is a participant of the Financial Commission Compensation Fund | FCA (Financial Conduct Authority) eToro (UK) Ltd (FCA reference 583263), eToro (Europe) Ltd CySEC (Cyprus Securities Exchange Commission), ASIC (Australian Securities and Investments Commission) eToro AUS Capital Limited ASIC license 491139, CySec (Cyprus Securities and Exchange Commission under the license 109/10), FSAS (Financial Services Authority Seychelles) eToro (Seychelles) Ltd license SD076, eToro (ME) Limited (ADGM) Abu Dhabi (UAE) number 220073, eToro (Europe) Ltd (AMF) Autorité des marchés financiers as a digital assets provider France | FCA (Financial Conduct Authority reference 522157) XTB Limited, CySEC (Cyprus Securities and Exchange Commission reference 169/12), DFSA (Dubai Financial Services Authority XTB MENA Limited licensed 8 July 2021), FSA (Financial Services Authority Seychelles license number SD148), FSCA (Financial Sector Conduct Authority XTB Africa (Pty) Ltd licensed 10 August 2021), KNF (Komisja Nadzoru Finansowego Polish Financial Supervision Authority) | Financial Sector Conduct Authority (FSCA) (49976) XM ZA (Pty) Ltd, Financial Services Commission (FSC) (000261/27) XM Global Limited, Cyprus Securities and Exchange Commission (CySEC) (license 120/10) Trading Point of Financial Instruments Ltd, Australian Securities and Investments Commission (ASIC) (number 443670) Trading Point of Financial Instruments Pty Ltd | Financial Conduct Authority (FCA), Australian Securities and Investments Commission (ASIC), Cyprus Securities and Exchange Commission (CySEC), Federal Financial Supervisory Authority (BaFin), Dubai Financial Services Authority (DFSA), Capital Markets Authority of Kenya (CMA), Pepperstone Markets Limited is incorporated in The Bahamas (number 177174 B), Licensed by the Securities Commission of The Bahamas (SCB) number SIA-F217 | Australian Securities and Investments Commission (ASIC) Ava Capital Markets Australia Pty Ltd (406684), South African Financial Sector Conduct Authority (FSCA) Ava Capital Markets Pty Ltd (45984), Financial Services Agency (Japan FSA) Ava Trade Japan K.K. (1662), Financial Futures Association of Japan (FFAJ) Ava Trade Japan K.K. (1574), Abu Dhabi Global Markets (ADGM) / Financial Regulatory Services Authority (FRSA) Ava Trade Middle East Ltd (190018), Central Bank of Ireland (C53877) AVA Trade EU Ltd, Polish Financial Supervision Authority (KNF) AVA Trade EU Ltd (branch authorisation), British Virgin Islands Financial Services Commission (BVI) Ava Trade Markets Ltd (SIBA/L/13/1049), Israel Securities Authority (ISA) ATrade Ltd (514666577), Financial Superintendence of Colombia (SFC 0261 of 2024), Investment Industry Regulatory Organization of Canada through Friedberg Direct (IIROC) | CySEC (Cyprus Securities and Exchange Commission) (371/18), ASIC AFS (Australian Securities and Investments Commission) (286354), FSP (Financial Sector Conduct Authority in South Africa) (50926), Financial Services Authority Seychelles (FSA) (SD 130) |
| Used By | 200,000+ | 730,000+ | 40,000,000+ | 2,000,000+ | 15,000,000+ | 830,000+ | 400,000+ | 200,000+ |
| Negative balance protection | Yes | Yes | Yes | Yes | Yes | Yes | Yes | Yes |
| Guaranteed Stop Loss | No | No | No | No | No | Yes | No | No |
| Learn More | Visit IC Markets | Visit Roboforex | Visit eToro | Visit XTB | Visit XM | Visit Pepperstone | Visit AvaTrade | Visit FP Markets |
| Risk Warning | Losses can exceed deposits | Losses can exceed deposits | 52% of retail investor accounts lose money when trading CFDs with this provider. | 69% - 80% of retail investor accounts lose money when trading CFDs with this provider. You should consider whether you understand how CFDs work and whether you can afford to take the high risk of losing your money. | CFDs are complex instruments and come with a high risk of losing money rapidly due to leverage. 74.48% of retail investor accounts lose money when trading CFDs with this provider. You should consider whether you understand how CFDs work and whether you can afford to take the high risk of losing your money. | 75-95 % of retail investor accounts lose money when trading CFDs | 57% of retail investor accounts lose money when trading CFDs with this provider | Losses can exceed deposits |
Are The Trading BRICs currency World Leading?
Opt for Trading BRICs currency that set themselves apart as an industry leader by actively embracing innovation. Take IC Markets as an example, which is renowned for Segregates clients funds and boasts an extensive array of 2850 tradable instruments. Moreover, IC Markets caters to the needs of its clients with both an online trading platform and a mobile application, making it incredibly convenient to access the markets from anywhere, at any time.
In addition, the IC Markets platform enables access to a variety of financial markets worldwide. IC Markets is a world-leader when it comes to innovation and they are always looking at ways to improve and to maintain their competitive advantage.
Another good choice when looking for Trading BRICs currency is Roboforex. Roboforex Segregates clients funds and offers over 12000 instruments.
| Broker |
IC Markets
|
Roboforex
|
eToro
|
XTB
|
XM
|
Pepperstone
|
AvaTrade
|
FP Markets
|
|---|---|---|---|---|---|---|---|---|
| Instruments Available | 2850 | 12000 | 7000 | 10900 | 1464 | 2700 | 1250 | 10000 |
| Platforms | MT5, MT4, MetaTrader WebTrader, Mobile Apps, iOS (App Store), Android (Google Play), MetaTrader iPhone/iPad, MetaTrader Android Google Play, MetaTrader Mac, cTrader, cTrader Web, cTrader iPhone/iPad, cTrader iMac, cTrader Android Google Play, cTrader Automate, cTrader Copy Trading, TradingView, Virtual Private Server, Trading Servers, MT4 Advanced Trading Tools, IC Insights, Trading Central | MT4, MT5, R Mobile Trader, R StocksTrader, WebTrader, Mobile Apps, iOS (App Store), Android (Google Play), Windows | eToro Trading App, Mobile Apps, iOS (App Store), Android (Google Play), CopyTrading, Web | MT4, Mirror Trader, Web Trader, Tablet, Mobile Apps, iOS (App Store), Android (Google Play) | MT5, MT5 WebTrader, XM Apple App for iPhone, XM App for Android Google Play, Tablet: MT5 for iPad, MT5 for Android Google Play, XM App for iPad, XM App for iOS (App Store), Android (Google Play), Mobile Apps | MT4, MT5, cTrader,WebTrader, TradingView, Windows, Mobile Apps, iOS (App Store), Android (Google Play) | MT4, MT5, Web Trading, AvaTrade App, AvaOptions, Mac Trading, AvaSocial, Mobile Apps, iOS (App Store), Android (Google Play) | MT4, MT5, TradingView, cTrader, WebTrader, Mobile Trader, Mobile Apps, iOS (App Store), Android (Google Play) |
| Excluded Countries | US, IR, CA, NZ, JP | AU, BE, BQ, BR, CA, CW, CZ, DE, ES, EE, EU, FM, FR, FI, GW, ID, IR, JP, LR, MP, NL, PF, PL, RU, SE, SJ, SS, SL, SI, TL, TR, DO, US, IT, AT, PT, BG, HR, CY, DK, FL, GR, IE, LV, LT, MT, RO, SK, CH | ZA, ID, IR, KP, BE, CA, JP, SY, TR, IL, BY, AL, MD, MK, RS, GN, CD, SD, SA, ZW, ET, GH, TZ, LY, UG, ZM, BW, RW, TN, SO, NA, TG, SL, LR, GM, DJ, CI, PK, BN, TW, WS, NP, SG, VI, TM, TJ, UZ, LK, TT, HT, MM, BT, MH, MV, MG, MK, KZ, GD, FJ, PT, BB, BM, BS, AG, AI, AW, AX, LB, SV, PY, HN, GT, PR, NI, VG, AN, CN, BZ, DZ, MY, KH, PH, VN, EG, MN, MO, UA, JO, KR, AO, BR, HR, GL, IS, IM, JM, FM, MC, NG, SI, | US, AU, CA, JP, KR, KP, SG, MU, IL, TR, IN, PK, BA, ET, UG, CU, SY, BD, NG, ID, BE, LY, MO, KE, YE, VU, GY, CD, CG, AF, LA, MZ, IQ, IR | US, CA, IL, IR | AF, AS, AQ, AM, AZ, BY, BE, BZ, BT, BA, BI, CM, CA, CF, TD, CG, CI, ER, GF, PF, GP, GU, GN, GW, GY, HT, VA, IR, IQ, JP, KZ, LB, LR, LY, ML, MQ, YT, MZ, MM, NZ, NI, KP, PS, PR, RE, KN, LC, VC, WS, SO, GS, KR, SS, SD, SR, SY, TJ, TN, TM, TC, US, VU, VG, EH, ES, YE, ZW, ET | BE, BR, KP, NZ, TR, US, CA, SG | US, JP, NZ |
| Forex pairs offered | 65 | 40 | 65 | 69 | 55 | 93 | 53 | 70 |
| Major forex pairs | Yes | Yes | Yes | Yes | Yes | Yes | Yes | Yes |
| Minor forex pairs | Yes | Yes | Yes | Yes | Yes | Yes | Yes | Yes |
| Exotic forex pairs | Yes | Yes | Yes | Yes | Yes | Yes | Yes | Yes |
| Cryptocurrencies (availability subject to regulation) | Yes | Yes | Yes | No | No | Yes | Yes | Yes |
| Commodities Offered | 28 | 100 | 67 | 27 | 8 | 40 | 19 | 29 |
| Metals | Yes | Yes | Yes | Yes | Yes | Yes | Yes | Yes |
| Energies | Yes | No | Yes | Yes | Yes | Yes | Yes | Yes |
| Agricultural | Yes | No | Yes | Yes | No | Yes | Yes | Yes |
| Stocks Offered | 2100 | 8484 | 7246 | 6617 | 1350 | 1100 | 647 | 10000 |
| UK Shares | Yes | Yes | Yes | Yes | Yes | Yes | Yes | Yes |
| US Shares | Yes | Yes | Yes | Yes | Yes | Yes | Yes | Yes |
| German Shares | Yes | Yes | Yes | Yes | Yes | Yes | Yes | Yes |
| Japanese Shares | Yes | Yes | Yes | Yes | Yes | Yes | Yes | Yes |
What are the Trading BRICs currency Commissions and Fees?
Ensure that your broker is transparent with fees and those dues are competitive.
The best rated Trading BRICs currency broker IC Markets offers competitive offers for Forex, CFDs, Spread Betting, Share dealing, Cryptocurrencies. IC Markets minimum deposit is 200.
Another top rated Trading BRICs currency broker Roboforex offers Forex, CFDs. Roboforex minimum deposit is 10. Please note that any cryptocurrency availability with any broker is subject to regulation.
| Broker |
IC Markets
|
Roboforex
|
eToro
|
XTB
|
XM
|
Pepperstone
|
AvaTrade
|
FP Markets
|
|---|---|---|---|---|---|---|---|---|
| Min Deposit | 200 | 10 | 50 | 0 | 5 | 0 | 100 | 100 |
| Withdrawl Fees | No | No | Yes | Yes | No | No | No | No |
| Inactivity Fees | No | No | Yes | Yes | Yes | No | Yes | No |
| Deposit Fees | No | No | No | No | No | No | No | No |
| CFD Commission Fees | Yes | No | Yes | Yes | No | Yes | No | Yes |
What are the Trading BRICs currency Funding and Withdrawal Methods?
Efficient and hassle-free funding and withdrawal facilities can significantly improve your overall trading experience when dealing with Trading BRICs currency. It streamlines the trading process and helps you focus on making informed decisions rather than worrying about deposit and withdrawal matters with Trading BRICs currency.
| Broker |
IC Markets
|
Roboforex
|
eToro
|
XTB
|
XM
|
Pepperstone
|
AvaTrade
|
FP Markets
|
|---|---|---|---|---|---|---|---|---|
| Bank transfer | Yes | Yes | Yes | Yes | Yes | Yes | Yes | Yes |
| Credit Cards | Yes | Yes | Yes | Yes | Yes | Yes | Yes | Yes |
| Paypal | Yes | No | Yes | Yes | No | Yes | Yes | Yes |
| Skrill | Yes | No | Yes | Yes | No | Yes | No | Yes |
| Payoneer | No | Yes | No | Yes | No | Yes | Yes | No |
| Neteller | Yes | Yes | Yes | Yes | Yes | Yes | Yes | Yes |
Find Trading BRICs currency with Round-the-clock support?
Effective customer service is an essential factor to consider when dealing with Trading BRICs currency.
Trading BRICs currency customer service entails various support services to aid customers in making the most cost-effective and appropriate use of the brokers' services.
The customer support options offered by Trading BRICs currency can include phone answering services, live chat support, and email customer service support.
IC Markets support a wide range of languages including English, Japanese, Chinese, Polish, Afrikans, Danish, Dutch, German and more
Roboforex support a wide range of languages including English, Chinese Simplified, Chinese Traditional, Indonesian, Malaysian, Portuguese, Spanish, Italian, Polish, Arabic, Thai, Russian, and Ukrainian
IC Markets and Roboforex offer support where clients are able to call or contact the helpdesk via email or a chat service.
| Broker |
IC Markets
|
Roboforex
|
eToro
|
XTB
|
XM
|
Pepperstone
|
AvaTrade
|
FP Markets
|
|---|---|---|---|---|---|---|---|---|
| Support |
|
|
|
|
|
|
|
|
| Languages | English, Japanese, Chinese, Polish, Afrikans, Danish, Dutch, German and more | English, Chinese Simplified, Chinese Traditional, Indonesian, Malaysian, Portuguese, Spanish, Italian, Polish, Arabic, Thai, Russian, and Ukrainian | English, German, Spanish, French, Italian | English, Spanish, Czech, Chinese, German, French, Italian, Polish, Portuguese, Romanian, Slovenian, and Turkish | Arabic, Chinese, English, French, German, Greek, Hindi, Hungarian, Indonesian, Italian, Japanese, Korean, Malay, Polish, Portuguese, Russian, Spanish, Swedish, Thai, and Turkish | English, Spanish, Portuguese, Thai, Russian, Italian, French, German, Polish, Chinese, Vietnamese, and Arabic | Arabic, Simplified Chinese, Traditional Chinese, Dutch, English, Finnish, French, German, Hungarian, Italian, Indonesian, Japanese, Mongolian, Polish, Portuguese, Russian, Spanish, Swedish, Thai, Malay, Korean and Turkish | English, Arabic, Indonesian, Italian, Spanish, French, Russian, Chinese, Japanese, German, Portuguese, Thai, French, Malay, Greek, Vietnamese, Romanian, Turkish, Slovenian, Dutch, Polish, Finnish, Norwegian, Swedish, Serbian, Lithuanian, Hungarian, Galician, Estonian, Danish, Czech, Croatian, Bulgarian, Basque |
| Learn More | Visit IC Markets | Visit Roboforex | Visit eToro | Visit XTB | Visit XM | Visit Pepperstone | Visit AvaTrade | Visit FP Markets |
| Risk Warning | Losses can exceed deposits | Losses can exceed deposits | 52% of retail investor accounts lose money when trading CFDs with this provider. | 69% - 80% of retail investor accounts lose money when trading CFDs with this provider. You should consider whether you understand how CFDs work and whether you can afford to take the high risk of losing your money. | CFDs are complex instruments and come with a high risk of losing money rapidly due to leverage. 74.48% of retail investor accounts lose money when trading CFDs with this provider. You should consider whether you understand how CFDs work and whether you can afford to take the high risk of losing your money. | 75-95 % of retail investor accounts lose money when trading CFDs | 57% of retail investor accounts lose money when trading CFDs with this provider | Losses can exceed deposits |
Make sure the Trading BRICs currency Offer Comprehensive Trader resources?
It's important to ensure your Trading BRICs currency provide complimentary resources such as analysis, education, and risk management tools. IC Markets and Roboforex collaborate with top analysts to bring the most up-to-date news and insights to traders.
Sound risk and money management are vital to financial market navigation with Trading BRICs currency. However, selecting the best broker to access the markets is a critical step that traders should not overlook as they embark on trading live financial markets with Trading BRICs currency.
Why Trading BRICs currency needs to be regulated?
Regulated Trading BRICs currency lowers your risk of loss of deposited trading funds.
Lowering your risk is one of the benefits of working with a properly regulated Trading BRICs currency.
Consumers are protected by Trading BRICs currency regulation, critical to preventing inadequate services and potential financial harm.
Regulation of Trading BRICs currency is necessary to prevent fraud. The Trading BRICs currency working capital and client-funded accounts must be kept separate to avoid conducting business with client funds. Any fraudulent behaviour with Trading BRICs currency is monitored by financial regulators in the jurisdictions brokers are allowed to operate.
Trading BRICs currency List
Funding methods
Bank transfer Credit Card PaypalPlatforms
MT5, MT4, MetaTrader WebTrader, Mobile Apps, iOS (App Store), Android (Google Play), MetaTrader iPhone/iPad, MetaTrader Android Google Play, MetaTrader Mac, cTrader, cTrader Web, cTrader iPhone/iPad, cTrader iMac, cTrader Android Google Play, cTrader Automate, cTrader Copy Trading, TradingView, Virtual Private Server, Trading Servers, MT4 Advanced Trading Tools, IC Insights, Trading CentralCustomer support
Live chat Phone support Email supportAccount Types
Micro account Standard account ECN accountIslamic account VIP account
Funding methods
Bank transfer Credit Card PaypalPlatforms
MT4, MT5, R Mobile Trader, R StocksTrader, WebTrader, Mobile Apps, iOS (App Store), Android (Google Play), WindowsCustomer support
Live chat Phone support Email supportAccount Types
Micro account Standard account ECN accountIslamic account VIP account
eToro is a multi-asset platform which offers both investing in stocks and cryptoassets, as well as trading CFDs.
Please note that CFDs are complex instruments and come with a high risk of losing money rapidly due to leverage. 52% of retail investor accounts lose money when trading CFDs with this provider. You should consider whether you understand how CFDs work, and whether you can afford to take the high risk of losing your money.
This communication is intended for information and educational purposes only and should not be considered investment advice or investment recommendation. Past performance is not an indication of future results.
Copy Trading does not amount to investment advice. The value of your investments may go up or down. Your capital is at risk.
Crypto investments are risky and may not suit retail investors; you could lose your entire investment. Understand the risks here.
Don't invest unless you're prepared to lose all the money you invest. This is a high-risk investment, and you should not expect to be protected if something goes wrong. Take 2 mins to learn more.
eToro USA LLC does not offer CFDs and makes no representation and assumes no liability as to the accuracy or completeness of the content of this publication, which has been prepared by our partner utilizing publicly available non-entity specific information about eToro.
Funding methods
Bank transfer Credit Card PaypalPlatforms
eToro Trading App, Mobile Apps, iOS (App Store), Android (Google Play), CopyTrading, WebCustomer support
Live chat Phone support Email supportAccount Types
Micro account Standard account ECN accountIslamic account VIP account
Funding methods
Bank transfer Credit Card PaypalPlatforms
MT4, Mirror Trader, Web Trader, Tablet, Mobile Apps, iOS (App Store), Android (Google Play)Customer support
Live chat Phone support Email supportAccount Types
Micro account Standard account ECN accountIslamic account VIP account
Funding methods
Bank transfer Credit Card PaypalPlatforms
MT5, MT5 WebTrader, XM Apple App for iPhone, XM App for Android Google Play, Tablet: MT5 for iPad, MT5 for Android Google Play, XM App for iPad, XM App for iOS (App Store), Android (Google Play), Mobile AppsCustomer support
Live chat Phone support Email supportAccount Types
Micro account Standard account ECN accountIslamic account XM Swap-Free account (XM Ultra Low Account) VIP account
Funding methods
Bank transfer Credit Card PaypalPlatforms
MT4, MT5, cTrader,WebTrader, TradingView, Windows, Mobile Apps, iOS (App Store), Android (Google Play)Customer support
Live chat Phone support Email supportAccount Types
Micro account Standard account ECN accountIslamic account Pro Account VIP account
Funding methods
Bank transfer Credit Card PaypalPlatforms
MT4, MT5, Web Trading, AvaTrade App, AvaOptions, Mac Trading, AvaSocial, Mobile Apps, iOS (App Store), Android (Google Play)Customer support
Live chat Phone support Email supportAccount Types
Micro account Standard account ECN accountIslamic account VIP account
Funding methods
Bank transfer Credit Card PaypalPlatforms
MT4, MT5, TradingView, cTrader, WebTrader, Mobile Trader, Mobile Apps, iOS (App Store), Android (Google Play)Customer support
Live chat Phone support Email supportAccount Types
Micro account Standard account ECN accountIslamic account VIP account
Funding methods
Bank transfer Credit Card PaypalPlatforms
Web, Mobile Apps, iOS (App Store), Android (Google Play), iPad App, iPhone App, TradingViewCustomer support
Live chat Phone support Email supportAccount Types
Micro account Standard account ECN accountIslamic account VIP account
Funding methods
Bank transfer Credit Card PaypalPlatforms
easyMarkets App, Mobile Apps, iOS (App Store), Android (Google Play), Web Platform, TradingView, MT4, MT5Customer support
Live chat Phone support Email supportAccount Types
Micro account Standard account ECN accountIslamic account VIP account
Funding methods
Bank transfer Credit Card PaypalPlatforms
MT4, MT5, cTrader, FxPro WebTrader, FxPro Mobile Apps, iOS (App Store), Android (Google Play)Customer support
Live chat Phone support Email supportAccount Types
Micro account Standard account ECN accountIslamic account VIP account

Learn more
Losses can exceed deposits

Losses can exceed deposits