Moving Average Crossover for 2026
We found 11 online brokers that are appropriate for Trading Moving Average Crossover Investment Platforms.
Moving Average Crossover Guide
Analysis by Andrew Blumer, Updated Last updated – June 12, 2026
Moving Average Crossover

Moving Average (MA) is a technical indicator that provides the average price of an underlying asset over a specified period of time. This average price can be used to gauge the current trend of an asset. The benefit of using a 'Moving Average' is that it is not affected by a few candles and continues to provide data about the long-term trend.
A trader can select the timeframe for MA (moving average) according to his need. Some of the popular values for MA are 20, 50, 100, and 200.
A MA of 20 periods on a 15-minute timeframe shows the average price of the last 300 minutes (5 hours).
MA(20) on 30-minute timeframe shows the average price of the last 600 minutes (10 hours).
Similarly, MA(20) on the daily timeframe shows the average price of the last 20 days.
Finding Trend With Moving Average
MA is considered a trend indicator, and when applied to a chart, it appears as a line on the chart window. Depending on the period of MA, this technical indicator can be used to see short, medium, and long-term trends.
MA(20) is used for the short-term trend.
MA(50) is used for medium-term trends.
MA(100) and MA(200) are used for the long-term trend.
Generally, if the price is trading above Moving Average, it signifies an uptrend.
For a downtrend, the price of an asset must be below the MA line.
The angle of the moving average can also be used for checking the current trend of an asset. An up trending angle is a sign of increasing financial markets, while a downward slope is considered a falling financial market.
A flat moving average line means no clear trend & as such, one should not trade such an asset.
What Is Moving Average Crossover?
MA crossover strategy is a combination of two or more moving averages of different periods. Usually, one MA is based on a shorter period, while the other is based on a longer period.
Bullish Crossover: Short-term MA crosses above the long-term MA.
Bearish Crossover: Short-term MA crosses below the long-term MA.
Let's assume our short-term MA is MA(20) and our long-term MA is MA(50)...
When the MA(20) crosses above the MA(50), it means a bullish trend.
Similarly, When the MA(20) crosses below the MA(50), it means a bearish trend.
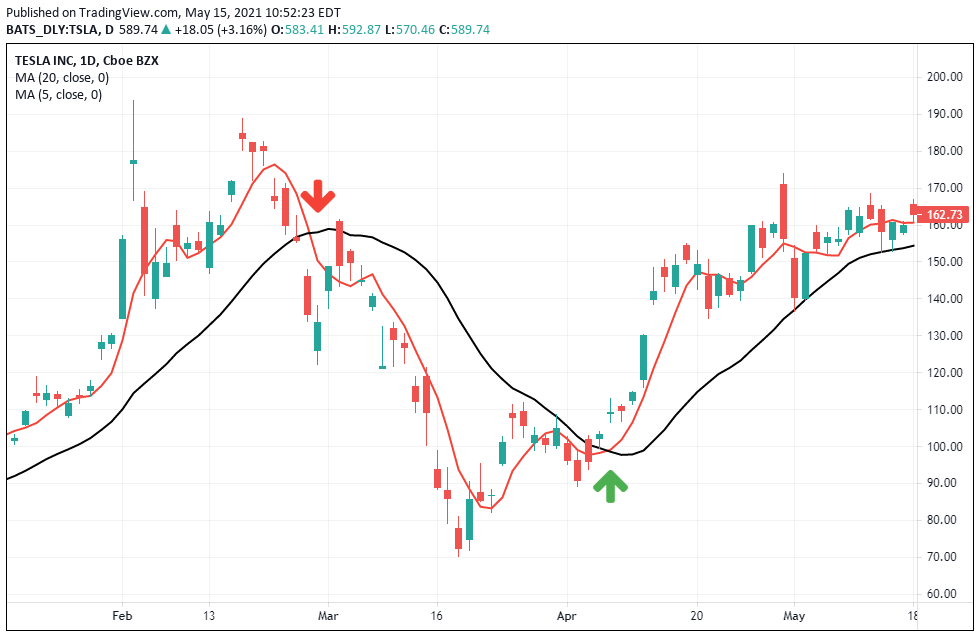
An example of this can be seen in the daily chart of TESLA Inc (TSLA).
On 28 Feb 2020, MA(20) crossed below the MA(50), showing a change in trend. As a result of this crossover, TSLA entered into a short-term downtrend.
In April 2020, MA(20) finally crossed above the MA(50), showing an uptrend. At the time of the crossover, TSLA was trading at $109.09. By the time we saw a bearish crossover in TSLA, the price was around $286.16.
Buying t 1 share of TSLA at the time of MA crossover (bullish) would have resulted in more than 100% ROI.
The Golden Cross
This crossover is based on MA(50) and MA(200). The Moving Average with 200 periods is usually considered to represent the long-term trend. The benefit of using these popular values for MA is that a lot of traders use these values. Any change in this MA can result in traders buying/selling the underlying assets. That's why it becomes important to stick with the popular values instead of coming up with new ones.
The golden cross is trendy among traders. When MA(50) crosses above MA(200), it points towards an uptrend. Unlike small Moving Averages, these 2 moving averages show the medium and long-term trend of an asset. As such, a cross-over of these long-period MA carries more significance.
Benefits of MA Crossover
Let's take a quick look at some of the benefits of using the MA crossover strategy:
- It provides an objective view of the current trend & takes the guesswork out.
- Makes it easy to enter or exit trades based on the trend direction provided by this strategy.
- It can be used to see short, medium, and long-term trends.
- This strategy is very flexible and versatile. A change in the value of both moving average periods can show us different trading signals.
Disadvantages of MA Crossover
Let's take a quick look at some of the disadvantages of using the MA crossover strategy:
- A big part of the trend is missed as MA crossover is based on lagging indicators (moving averages).
- Sometimes, an asset can keep on moving high and low. This results in several moving average crosses. Trading in such an environment can result in capital loss as opposite signals keep on appearing.
Types of MA Crossovers
The most popular moving averages are:
- Simple Moving Average
- Exponential Moving Average
There are many different MAs, but the most popular ones are SMA and EMA.
While the SMA gives equal weight (importance) to all the candles, EMA gives more importance to recent price data. As a result, an EMA crossover can give an early signal as compared to an SMA crossover.
Choosing SMA or EMA for the crossover strategy depends on the trading style of each trader. Some prefer SMA, while others believe in the power of exponential moving averages.
We have conducted extensive research and analysis on over multiple data points on Moving Average Crossover to present you with a comprehensive guide that can help you find the most suitable Moving Average Crossover. Below we shortlist what we think are the best Moving Average Crossover Investment Platforms after careful consideration and evaluation. We hope this list will assist you in making an informed decision when researching Moving Average Crossover.
Reputable Moving Average Crossover Checklist
Selecting a reliable and reputable online Moving Average Crossover Investment Platforms trading brokerage involves assessing their track record, regulatory status, customer support, processing times, international presence, and language capabilities. Considering these factors, you can make an informed decision and trade Moving Average Crossover Investment Platforms more confidently.
Selecting the right online Moving Average Crossover Investment Platforms trading brokerage requires careful consideration of several critical factors. Here are some essential points to keep in mind:
- Ensure your chosen Moving Average Crossover Investment Platforms broker has a solid track record of at least two years in the industry.
- Verify that the Moving Average Crossover Investment Platforms broker has a customer support team of at least 15 members responsive to queries and concerns.
- Check if the Moving Average Crossover Investment Platforms broker operates under the regulatory framework of a jurisdiction that can hold it accountable for any misconduct or resolve disputes fairly and impartially.
- Ensure that the Moving Average Crossover Investment Platforms broker can process deposits and withdrawals within two to three days, which is crucial when you need to access your funds quickly.
- Look for Moving Average Crossover Investment Platforms brokers with an international presence in multiple countries, offering its clients local seminars and training programs.
- Ensure the Moving Average Crossover Investment Platforms broker can hire staff from diverse locations worldwide who can communicate fluently in your local language.
Our team have listed brokers that match your criteria for you below. All brokerage data has been summarised into a comparison table. Scroll down.
Compare Key Features of Moving Average Crossover Investment Platforms in Our Brokerage Comparison Table
When choosing a broker for Moving Average Crossover Investment Platforms trading, it's essential to compare the different options available to you. Our Moving Average Crossover Investment Platforms brokerage comparison table below allows you to compare several important features side by side, making it easier to make an informed choice.
- Minimum deposit requirement for opening an account with each Moving Average Crossover Investment Platforms broker.
- The funding methods available for Moving Average Crossover Investment Platforms with each broker.
- The types of instruments you can trade with each Moving Average Crossover Investment Platforms broker, such as forex, stocks, commodities, and indices.
- The trading platforms each Moving Average Crossover Investment Platforms broker provides, including their features, ease of use, and compatibility with your devices.
- The spread type (if applicable) for each Moving Average Crossover Investment Platforms broker affects the cost of trading.
- The level of customer support each Moving Average Crossover Investment Platforms broker offers, including their availability, responsiveness, and quality of service.
- Whether each Moving Average Crossover Investment Platforms broker offers Micro, Standard, VIP, or Islamic accounts to suit your trading style and preferences.
By comparing these essential features, you can choose a Moving Average Crossover Investment Platforms broker that best suits your needs and preferences for Moving Average Crossover Investment Platforms. Our Moving Average Crossover Investment Platforms broker comparison table simplifies the process, allowing you to make a more informed decision.
Top 15 Moving Average Crossover Investment Platforms of 2026 compared
Here are the top Moving Average Crossover Investment Platforms.
Compare Moving Average Crossover Investment Platforms brokers for min deposits, funding, used by, benefits, account types, platforms, and support levels. When searching for a Moving Average Crossover Investment Platforms broker, it's crucial to compare several factors to choose the right one for your Moving Average Crossover Investment Platforms needs. Our comparison tool allows you to compare the essential features side by side.
All brokers below are Moving Average Crossover Investment Platforms. Learn more about what they offer below.
You can scroll left and right on the comparison table below to see more Moving Average Crossover Investment Platforms that accept Moving Average Crossover Investment Platforms clients.
| Broker |
IC Markets

|
Roboforex

|
eToro

|
XTB

|
XM

|
Pepperstone

|
AvaTrade

|
FP Markets

|
EasyMarkets

|
SpreadEx

|
FXPro

|
|---|---|---|---|---|---|---|---|---|---|---|---|
| Rating | |||||||||||
| Regulation | International Capital Markets Pty Ltd (Australia) (ASIC) Australian Securities & Investments Commission Licence No. 335692, Seychelles Financial Services Authority (FSA) (SD018), IC Markets (EU) Ltd (CySEC) Cyprus Securities and Exchange Commission with License No. 362/18, Capital Markets Authority(CMA) Kenya IC Markets (KE) Ltd, Securities Commission of The Bahamas (SCB) IC Markets (Bahamas) Ltd | RoboForex Ltd is authorised and regulated by the Financial Services Commission (FSC) of Belize under licence No. 000138/32, under the Securities Industry Act 2021, RoboForex Ltd is an (A category) member of The Financial Commission, also RoboForex Ltd is a participant of the Financial Commission Compensation Fund | FCA (Financial Conduct Authority) eToro (UK) Ltd (FCA reference 583263), eToro (Europe) Ltd CySEC (Cyprus Securities Exchange Commission), ASIC (Australian Securities and Investments Commission) eToro AUS Capital Limited ASIC license 491139, CySec (Cyprus Securities and Exchange Commission under the license 109/10), FSAS (Financial Services Authority Seychelles) eToro (Seychelles) Ltd license SD076, eToro (ME) Limited (ADGM) Abu Dhabi (UAE) number 220073, eToro (Europe) Ltd (AMF) Autorité des marchés financiers as a digital assets provider France | FCA (Financial Conduct Authority reference 522157) XTB Limited, CySEC (Cyprus Securities and Exchange Commission reference 169/12), DFSA (Dubai Financial Services Authority XTB MENA Limited licensed 8 July 2021), FSA (Financial Services Authority Seychelles license number SD148), FSCA (Financial Sector Conduct Authority XTB Africa (Pty) Ltd licensed 10 August 2021), KNF (Komisja Nadzoru Finansowego Polish Financial Supervision Authority) | Financial Sector Conduct Authority (FSCA) (49976) XM ZA (Pty) Ltd, Financial Services Commission (FSC) (000261/27) XM Global Limited, Cyprus Securities and Exchange Commission (CySEC) (license 120/10) Trading Point of Financial Instruments Ltd, Australian Securities and Investments Commission (ASIC) (number 443670) Trading Point of Financial Instruments Pty Ltd | Financial Conduct Authority (FCA), Australian Securities and Investments Commission (ASIC), Cyprus Securities and Exchange Commission (CySEC), Federal Financial Supervisory Authority (BaFin), Dubai Financial Services Authority (DFSA), Capital Markets Authority of Kenya (CMA), Pepperstone Markets Limited is incorporated in The Bahamas (number 177174 B), Licensed by the Securities Commission of The Bahamas (SCB) number SIA-F217 | Australian Securities and Investments Commission (ASIC) Ava Capital Markets Australia Pty Ltd (406684), South African Financial Sector Conduct Authority (FSCA) Ava Capital Markets Pty Ltd (45984), Financial Services Agency (Japan FSA) Ava Trade Japan K.K. (1662), Financial Futures Association of Japan (FFAJ) Ava Trade Japan K.K. (1574), Abu Dhabi Global Markets (ADGM) / Financial Regulatory Services Authority (FRSA) Ava Trade Middle East Ltd (190018), Central Bank of Ireland (C53877) AVA Trade EU Ltd, Polish Financial Supervision Authority (KNF) AVA Trade EU Ltd (branch authorisation), British Virgin Islands Financial Services Commission (BVI) Ava Trade Markets Ltd (SIBA/L/13/1049), Israel Securities Authority (ISA) ATrade Ltd (514666577), Financial Superintendence of Colombia (SFC 0261 of 2024), Investment Industry Regulatory Organization of Canada through Friedberg Direct (IIROC) | CySEC (Cyprus Securities and Exchange Commission) (371/18), ASIC AFS (Australian Securities and Investments Commission) (286354), FSP (Financial Sector Conduct Authority in South Africa) (50926), Financial Services Authority Seychelles (FSA) (SD 130) | Easy Forex Trading Ltd is regulated by CySEC (License 079/07). This is the only entity that onboards EU clients. easyMarkets Pty Ltd is regulated by ASIC (AFS License 246566), EF Worldwide Ltd (Seychelles) is regulated by FSA (License SD056), EF Worldwide Ltd (British Virgin Islands) is regulated by FSC (License SIBA/L/20/1135), EF Worldwide (PTY) Ltd is regulated by FSCA (License 54018) | FCA (Financial Conduct Authority) (190941), Gambling Commission (Great Britain) (8835), licence in Ireland as remote bookmaker for fixed odds betting licence number 1016176 | FCA (Financial Conduct Authority) (509956), CySEC (Cyprus Securities and Exchange Commission) (078/07), FSCA (Financial Sector Conduct Authority) (45052), SCB (Securities Commission of The Bahamas) (SIA-F184), FSA (Financial Services Authority of Seychelles) (SD120) |
| Min Deposit | 200 | 10 | 50 | No minimum deposit | 5 | No minimum deposit | 100 | 100 | 25 | No minimum deposit | 100 |
| Funding |
|
|
|
|
|
|
|
|
|
|
|
| Used By | 200,000+ | 730,000+ | 40,000,000+ | 2,000,000+ | 15,000,000+ | 830,000+ | 400,000+ | 200,000+ | 250,000+ | 60,000+ | 11,200,000+ |
| Benefits |
|
|
|
|
|
|
|
|
|
|
|
| Accounts |
|
|
|
|
|
|
|
|
|
|
|
| Platforms | MT5, MT4, MetaTrader WebTrader, Mobile Apps, iOS (App Store), Android (Google Play), MetaTrader iPhone/iPad, MetaTrader Android Google Play, MetaTrader Mac, cTrader, cTrader Web, cTrader iPhone/iPad, cTrader iMac, cTrader Android Google Play, cTrader Automate, cTrader Copy Trading, TradingView, Virtual Private Server, Trading Servers, MT4 Advanced Trading Tools, IC Insights, Trading Central | MT4, MT5, R Mobile Trader, R StocksTrader, WebTrader, Mobile Apps, iOS (App Store), Android (Google Play), Windows | eToro Trading App, Mobile Apps, iOS (App Store), Android (Google Play), CopyTrading, Web | MT4, Mirror Trader, Web Trader, Tablet, Mobile Apps, iOS (App Store), Android (Google Play) | MT5, MT5 WebTrader, XM Apple App for iPhone, XM App for Android Google Play, Tablet: MT5 for iPad, MT5 for Android Google Play, XM App for iPad, XM App for iOS (App Store), Android (Google Play), Mobile Apps | MT4, MT5, cTrader,WebTrader, TradingView, Windows, Mobile Apps, iOS (App Store), Android (Google Play) | MT4, MT5, Web Trading, AvaTrade App, AvaOptions, Mac Trading, AvaSocial, Mobile Apps, iOS (App Store), Android (Google Play) | MT4, MT5, TradingView, cTrader, WebTrader, Mobile Trader, Mobile Apps, iOS (App Store), Android (Google Play) | easyMarkets App, Mobile Apps, iOS (App Store), Android (Google Play), Web Platform, TradingView, MT4, MT5 | Web, Mobile Apps, iOS (App Store), Android (Google Play), iPad App, iPhone App, TradingView | MT4, MT5, cTrader, FxPro WebTrader, FxPro Mobile Apps, iOS (App Store), Android (Google Play) |
| Support |
|
|
|
|
|
|
|
|
|
|
|
| Learn More |
Sign
Up with icmarkets |
Sign
Up with roboforex |
Sign
Up with etoro |
Sign
Up with xtb |
Sign
Up with xm |
Sign
Up with pepperstone |
Sign
Up with avatrade |
Sign
Up with fpmarkets |
Sign
Up with easymarkets |
Sign
Up with spreadex |
Sign
Up with fxpro |
| Risk Warning | Losses can exceed deposits | Losses can exceed deposits | 52% of retail investor accounts lose money when trading CFDs with this provider. | 69% - 80% of retail investor accounts lose money when trading CFDs with this provider. You should consider whether you understand how CFDs work and whether you can afford to take the high risk of losing your money. | CFDs are complex instruments and come with a high risk of losing money rapidly due to leverage. 74.48% of retail investor accounts lose money when trading CFDs with this provider. You should consider whether you understand how CFDs work and whether you can afford to take the high risk of losing your money. | 74-95 % of retail investor accounts lose money when trading CFDs | 57% of retail investor accounts lose money when trading CFDs with this provider | Losses can exceed deposits | 76% of retail investor accounts lose money when trading CFDs with this provider. | 62% of retail CFD accounts lose money | 74% of retail investor accounts lose money when trading CFDs and Spread Betting with this provider |
| Demo |
IC Markets Demo |
Roboforex Demo |
eToro Demo |
XTB Demo |
XM Demo |
Pepperstone Demo |
AvaTrade Demo |
FP Markets Demo |
easyMarkets Demo |
SpreadEx Demo |
FxPro Demo |
| Excluded Countries | US, IR, CA, NZ, JP | AU, BE, BQ, BR, CA, CW, CZ, DE, ES, EE, EU, FM, FR, FI, GW, ID, IR, JP, LR, MP, NL, PF, PL, RU, SE, SJ, SS, SL, SI, TL, TR, DO, US, IT, AT, PT, BG, HR, CY, DK, FL, GR, IE, LV, LT, MT, RO, SK, CH | ZA, ID, IR, KP, BE, CA, JP, SY, TR, IL, BY, AL, MD, MK, RS, GN, CD, SD, SA, ZW, ET, GH, TZ, LY, UG, ZM, BW, RW, TN, SO, NA, TG, SL, LR, GM, DJ, CI, PK, BN, TW, WS, NP, SG, VI, TM, TJ, UZ, LK, TT, HT, MM, BT, MH, MV, MG, MK, KZ, GD, FJ, PT, BB, BM, BS, AG, AI, AW, AX, LB, SV, PY, HN, GT, PR, NI, VG, AN, CN, BZ, DZ, MY, KH, PH, VN, EG, MN, MO, UA, JO, KR, AO, BR, HR, GL, IS, IM, JM, FM, MC, NG, SI, | US, IN, PK, BD, NG , ID, BE, AU | US, CA, IL, IR | AF, AS, AQ, AM, AZ, BY, BE, BZ, BT, BA, BI, CM, CA, CF, TD, CG, CI, ER, GF, PF, GP, GU, GN, GW, GY, HT, VA, IR, IQ, JP, KZ, LB, LR, LY, ML, MQ, YT, MZ, MM, NZ, NI, KP, PS, PR, RE, KN, LC, VC, WS, SO, GS, KR, SS, SD, SR, SY, TJ, TN, TM, TC, US, VU, VG, EH, ES, YE, ZW, ET | BE, BR, KP, NZ, TR, US, CA, SG | US, JP, NZ | US, IL, BC, MB, QC, ON, AF, BY, BI, KH, KY, TD, KM, CG, CU, CD, GQ, ER, FJ, GN, GW, HT, IR, IQ, LA, LY, MZ, MM, NI, KP, PW, PA, RU, SO, SS, SD, SY, TT, TM, VU, VE, YE | US, TR | US, CA, IR |
All Moving Average Crossover Investment Platforms in more detail
You can compare Moving Average Crossover Investment Platforms ratings, min deposits what the the broker offers, funding methods, platforms, spread types, customer support options, regulation and account types side by side.
We also have an indepth Top Moving Average Crossover Investment Platforms for 2026 article further below. You can see it now by clicking here
We have listed top Moving Average Crossover Investment Platforms below.
Moving Average Crossover Table of Contents
- Moving Average Crossover Explained
- 6 Factors to Consider when Choosing Moving Average Crossover
- Are Your Moving Average Crossover Trusted And Established?
- Are The Moving Average Crossover World Leading?
- What are the Moving Average Crossover Commissions and Fees?
- What are the Moving Average Crossover Funding and Withdrawl Methods?
- Find Moving Average Crossover with Round-the-clock support?
- Make sure the Moving Average Crossover Offer Comprehensive Trader resources?
- Why Moving Average Crossover needs to be regulated?
- Moving Average Crossover FAQ
- What are the best Moving Average Crossover Investment Platforms brokers?
- What is the best Moving Average Crossover Investment Platform broker?
- Related Moving Average Crossover Reviews
- Related Moving Average Crossover Alternatives
- Related Moving Average Crossover Comparisons
Moving Average Crossover Explained
Trading volatile financial markets with Moving Average Crossover can be challenging, even for experienced traders. In addition to the online educational resources available, traders should consider the platform offered by Moving Average Crossover to ensure a successful trading experience.
Selecting Moving Average Crossover at the forefront of innovation and considered an industry leader is crucial. Doing so will ensure you are equipped with the tools and features to navigate volatile Moving Average Crossover markets effectively.
Reliability is key to gaining access to financial markets. Look for Moving Average Crossover that you can rely on to provide a stable and secure trading environment, allowing you to execute trades with Moving Average Crossover confidently.
6 Factors to Consider when Choosing Moving Average Crossover
Follow these five rules for selecting Moving Average Crossover that are right for you:
Are Your Moving Average Crossover Trusted And Established?
Search for a reputable Moving Average Crossover with a extensive proven track record for Moving Average Crossover, enabling you to focus solely on implementing your trading strategy and navigating the markets with confidence. The top rated Moving Average Crossover broker is IC Markets. Established in 2007, and in operation for 19 years IC Markets have a head office in Australia.
IC Markets is regulated. This means IC Markets are supervised by and is checked for conduct by International Capital Markets Pty Ltd (Australia) (ASIC) Australian Securities & Investments Commission Licence No. 335692, Seychelles Financial Services Authority (FSA) (SD018), IC Markets (EU) Ltd (CySEC) Cyprus Securities and Exchange Commission with License No. 362/18, Capital Markets Authority(CMA) Kenya IC Markets (KE) Ltd, Securities Commission of The Bahamas (SCB) IC Markets (Bahamas) Ltd regulatory bodies.
Another top rated broker is Roboforex.
Roboforex was established 2009, and in operation for 17 years Roboforex have a head office in Belize.
Roboforex is regulated. This means Roboforex are supervised by and is checked for conduct by International Capital Markets Pty Ltd (Australia) (ASIC) Australian Securities & Investments Commission Licence No. 335692, Seychelles Financial Services Authority (FSA) (SD018), IC Markets (EU) Ltd (CySEC) Cyprus Securities and Exchange Commission with License No. 362/18, Capital Markets Authority(CMA) Kenya IC Markets (KE) Ltd, Securities Commission of The Bahamas (SCB) IC Markets (Bahamas) Ltd regulatory bodies.
| Broker |
IC Markets
|
Roboforex
|
eToro
|
XTB
|
XM
|
Pepperstone
|
AvaTrade
|
FP Markets
|
|---|---|---|---|---|---|---|---|---|
| Year Established | 2007 | 2009 | 2007 | 2002 | 2009 | 2010 | 2006 | 2005 |
| Head Office | Australia | Belize | Cyprus, UK | Poland | Cyprus | Australia | Ireland | Australia |
| Regulation | International Capital Markets Pty Ltd (Australia) (ASIC) Australian Securities & Investments Commission Licence No. 335692, Seychelles Financial Services Authority (FSA) (SD018), IC Markets (EU) Ltd (CySEC) Cyprus Securities and Exchange Commission with License No. 362/18, Capital Markets Authority(CMA) Kenya IC Markets (KE) Ltd, Securities Commission of The Bahamas (SCB) IC Markets (Bahamas) Ltd | RoboForex Ltd is authorised and regulated by the Financial Services Commission (FSC) of Belize under licence No. 000138/32, under the Securities Industry Act 2021, RoboForex Ltd is an (A category) member of The Financial Commission, also RoboForex Ltd is a participant of the Financial Commission Compensation Fund | FCA (Financial Conduct Authority) eToro (UK) Ltd (FCA reference 583263), eToro (Europe) Ltd CySEC (Cyprus Securities Exchange Commission), ASIC (Australian Securities and Investments Commission) eToro AUS Capital Limited ASIC license 491139, CySec (Cyprus Securities and Exchange Commission under the license 109/10), FSAS (Financial Services Authority Seychelles) eToro (Seychelles) Ltd license SD076, eToro (ME) Limited (ADGM) Abu Dhabi (UAE) number 220073, eToro (Europe) Ltd (AMF) Autorité des marchés financiers as a digital assets provider France | FCA (Financial Conduct Authority reference 522157) XTB Limited, CySEC (Cyprus Securities and Exchange Commission reference 169/12), DFSA (Dubai Financial Services Authority XTB MENA Limited licensed 8 July 2021), FSA (Financial Services Authority Seychelles license number SD148), FSCA (Financial Sector Conduct Authority XTB Africa (Pty) Ltd licensed 10 August 2021), KNF (Komisja Nadzoru Finansowego Polish Financial Supervision Authority) | Financial Sector Conduct Authority (FSCA) (49976) XM ZA (Pty) Ltd, Financial Services Commission (FSC) (000261/27) XM Global Limited, Cyprus Securities and Exchange Commission (CySEC) (license 120/10) Trading Point of Financial Instruments Ltd, Australian Securities and Investments Commission (ASIC) (number 443670) Trading Point of Financial Instruments Pty Ltd | Financial Conduct Authority (FCA), Australian Securities and Investments Commission (ASIC), Cyprus Securities and Exchange Commission (CySEC), Federal Financial Supervisory Authority (BaFin), Dubai Financial Services Authority (DFSA), Capital Markets Authority of Kenya (CMA), Pepperstone Markets Limited is incorporated in The Bahamas (number 177174 B), Licensed by the Securities Commission of The Bahamas (SCB) number SIA-F217 | Australian Securities and Investments Commission (ASIC) Ava Capital Markets Australia Pty Ltd (406684), South African Financial Sector Conduct Authority (FSCA) Ava Capital Markets Pty Ltd (45984), Financial Services Agency (Japan FSA) Ava Trade Japan K.K. (1662), Financial Futures Association of Japan (FFAJ) Ava Trade Japan K.K. (1574), Abu Dhabi Global Markets (ADGM) / Financial Regulatory Services Authority (FRSA) Ava Trade Middle East Ltd (190018), Central Bank of Ireland (C53877) AVA Trade EU Ltd, Polish Financial Supervision Authority (KNF) AVA Trade EU Ltd (branch authorisation), British Virgin Islands Financial Services Commission (BVI) Ava Trade Markets Ltd (SIBA/L/13/1049), Israel Securities Authority (ISA) ATrade Ltd (514666577), Financial Superintendence of Colombia (SFC 0261 of 2024), Investment Industry Regulatory Organization of Canada through Friedberg Direct (IIROC) | CySEC (Cyprus Securities and Exchange Commission) (371/18), ASIC AFS (Australian Securities and Investments Commission) (286354), FSP (Financial Sector Conduct Authority in South Africa) (50926), Financial Services Authority Seychelles (FSA) (SD 130) |
| Used By | 200,000+ | 730,000+ | 40,000,000+ | 2,000,000+ | 15,000,000+ | 830,000+ | 400,000+ | 200,000+ |
| Negative balance protection | Yes | Yes | Yes | Yes | Yes | Yes | Yes | Yes |
| Guaranteed Stop Loss | No | No | No | No | No | Yes | No | No |
| Learn More | Visit IC Markets | Visit Roboforex | Visit eToro | Visit XTB | Visit XM | Visit Pepperstone | Visit AvaTrade | Visit FP Markets |
| Risk Warning | Losses can exceed deposits | Losses can exceed deposits | 52% of retail investor accounts lose money when trading CFDs with this provider. | 69% - 80% of retail investor accounts lose money when trading CFDs with this provider. You should consider whether you understand how CFDs work and whether you can afford to take the high risk of losing your money. | CFDs are complex instruments and come with a high risk of losing money rapidly due to leverage. 74.48% of retail investor accounts lose money when trading CFDs with this provider. You should consider whether you understand how CFDs work and whether you can afford to take the high risk of losing your money. | 74-95 % of retail investor accounts lose money when trading CFDs | 57% of retail investor accounts lose money when trading CFDs with this provider | Losses can exceed deposits |
Are The Moving Average Crossover World Leading?
Opt for Moving Average Crossover that set themselves apart as an industry leader by actively embracing innovation. Take IC Markets as an example, which is renowned for Segregates clients funds and boasts an extensive array of 2250 tradable instruments. Moreover, IC Markets caters to the needs of its clients with both an online trading platform and a mobile application, making it incredibly convenient to access the markets from anywhere, at any time.
In addition, the IC Markets platform enables access to a variety of financial markets worldwide. IC Markets is a world-leader when it comes to innovation and they are always looking at ways to improve and to maintain their competitive advantage.
Another good choice when looking for Moving Average Crossover is Roboforex. Roboforex Segregates clients funds and offers over 12000 instruments.
| Broker |
IC Markets
|
Roboforex
|
eToro
|
XTB
|
XM
|
Pepperstone
|
AvaTrade
|
FP Markets
|
|---|---|---|---|---|---|---|---|---|
| Instruments Available | 2250 | 12000 | 7000 | 10900 | 1464 | 2700 | 1250 | 10000 |
| Platforms | MT5, MT4, MetaTrader WebTrader, Mobile Apps, iOS (App Store), Android (Google Play), MetaTrader iPhone/iPad, MetaTrader Android Google Play, MetaTrader Mac, cTrader, cTrader Web, cTrader iPhone/iPad, cTrader iMac, cTrader Android Google Play, cTrader Automate, cTrader Copy Trading, TradingView, Virtual Private Server, Trading Servers, MT4 Advanced Trading Tools, IC Insights, Trading Central | MT4, MT5, R Mobile Trader, R StocksTrader, WebTrader, Mobile Apps, iOS (App Store), Android (Google Play), Windows | eToro Trading App, Mobile Apps, iOS (App Store), Android (Google Play), CopyTrading, Web | MT4, Mirror Trader, Web Trader, Tablet, Mobile Apps, iOS (App Store), Android (Google Play) | MT5, MT5 WebTrader, XM Apple App for iPhone, XM App for Android Google Play, Tablet: MT5 for iPad, MT5 for Android Google Play, XM App for iPad, XM App for iOS (App Store), Android (Google Play), Mobile Apps | MT4, MT5, cTrader,WebTrader, TradingView, Windows, Mobile Apps, iOS (App Store), Android (Google Play) | MT4, MT5, Web Trading, AvaTrade App, AvaOptions, Mac Trading, AvaSocial, Mobile Apps, iOS (App Store), Android (Google Play) | MT4, MT5, TradingView, cTrader, WebTrader, Mobile Trader, Mobile Apps, iOS (App Store), Android (Google Play) |
| Excluded Countries | US, IR, CA, NZ, JP | AU, BE, BQ, BR, CA, CW, CZ, DE, ES, EE, EU, FM, FR, FI, GW, ID, IR, JP, LR, MP, NL, PF, PL, RU, SE, SJ, SS, SL, SI, TL, TR, DO, US, IT, AT, PT, BG, HR, CY, DK, FL, GR, IE, LV, LT, MT, RO, SK, CH | ZA, ID, IR, KP, BE, CA, JP, SY, TR, IL, BY, AL, MD, MK, RS, GN, CD, SD, SA, ZW, ET, GH, TZ, LY, UG, ZM, BW, RW, TN, SO, NA, TG, SL, LR, GM, DJ, CI, PK, BN, TW, WS, NP, SG, VI, TM, TJ, UZ, LK, TT, HT, MM, BT, MH, MV, MG, MK, KZ, GD, FJ, PT, BB, BM, BS, AG, AI, AW, AX, LB, SV, PY, HN, GT, PR, NI, VG, AN, CN, BZ, DZ, MY, KH, PH, VN, EG, MN, MO, UA, JO, KR, AO, BR, HR, GL, IS, IM, JM, FM, MC, NG, SI, | US, AU, CA, JP, KR, KP, SG, MU, IL, TR, IN, PK, BA, ET, UG, CU, SY, BD, NG, ID, BE, LY, MO, KE, YE, VU, GY, CD, CG, AF, LA, MZ, IQ, IR | US, CA, IL, IR | AF, AS, AQ, AM, AZ, BY, BE, BZ, BT, BA, BI, CM, CA, CF, TD, CG, CI, ER, GF, PF, GP, GU, GN, GW, GY, HT, VA, IR, IQ, JP, KZ, LB, LR, LY, ML, MQ, YT, MZ, MM, NZ, NI, KP, PS, PR, RE, KN, LC, VC, WS, SO, GS, KR, SS, SD, SR, SY, TJ, TN, TM, TC, US, VU, VG, EH, ES, YE, ZW, ET | BE, BR, KP, NZ, TR, US, CA, SG | US, JP, NZ |
| Forex pairs offered | 65 | 40 | 65 | 69 | 55 | 93 | 53 | 70 |
| Major forex pairs | Yes | Yes | Yes | Yes | Yes | Yes | Yes | Yes |
| Minor forex pairs | Yes | Yes | Yes | Yes | Yes | Yes | Yes | Yes |
| Exotic forex pairs | Yes | Yes | Yes | Yes | Yes | Yes | Yes | Yes |
| Cryptocurrencies (availability subject to regulation) | Yes | Yes | Yes | No | No | Yes | Yes | Yes |
| Commodities Offered | 28 | 100 | 67 | 27 | 8 | 40 | 19 | 29 |
| Metals | Yes | Yes | Yes | Yes | Yes | Yes | Yes | Yes |
| Energies | Yes | No | Yes | Yes | Yes | Yes | Yes | Yes |
| Agricultural | Yes | No | Yes | Yes | No | Yes | Yes | Yes |
| Stocks Offered | 2100 | 8484 | 7246 | 6617 | 1350 | 1100 | 647 | 10000 |
| UK Shares | Yes | Yes | Yes | Yes | Yes | Yes | Yes | Yes |
| US Shares | Yes | Yes | Yes | Yes | Yes | Yes | Yes | Yes |
| German Shares | Yes | Yes | Yes | Yes | Yes | Yes | Yes | Yes |
| Japanese Shares | Yes | Yes | Yes | Yes | Yes | Yes | Yes | Yes |
What are the Moving Average Crossover Commissions and Fees?
Ensure that your broker is transparent with fees and those dues are competitive.
The best rated Moving Average Crossover broker IC Markets offers competitive offers for Forex, CFDs, Spread Betting, Share dealing, Cryptocurrencies. IC Markets minimum deposit is 200.
Another top rated Moving Average Crossover broker Roboforex offers Forex, CFDs. Roboforex minimum deposit is 10. Please note that any cryptocurrency availability with any broker is subject to regulation.
| Broker |
IC Markets
|
Roboforex
|
eToro
|
XTB
|
XM
|
Pepperstone
|
AvaTrade
|
FP Markets
|
|---|---|---|---|---|---|---|---|---|
| Min Deposit | 200 | 10 | 50 | 0 | 5 | 0 | 100 | 100 |
| Withdrawl Fees | No | No | Yes | Yes | No | No | No | No |
| Inactivity Fees | No | No | Yes | Yes | Yes | No | Yes | No |
| Deposit Fees | No | No | No | No | No | No | No | No |
| CFD Commission Fees | Yes | No | Yes | Yes | No | Yes | No | Yes |
What are the Moving Average Crossover Funding and Withdrawal Methods?
Efficient and hassle-free funding and withdrawal facilities can significantly improve your overall trading experience when dealing with Moving Average Crossover. It streamlines the trading process and helps you focus on making informed decisions rather than worrying about deposit and withdrawal matters with Moving Average Crossover.
| Broker |
IC Markets
|
Roboforex
|
eToro
|
XTB
|
XM
|
Pepperstone
|
AvaTrade
|
FP Markets
|
|---|---|---|---|---|---|---|---|---|
| Bank transfer | Yes | Yes | Yes | Yes | Yes | Yes | Yes | Yes |
| Credit Cards | Yes | Yes | Yes | Yes | Yes | Yes | Yes | Yes |
| Paypal | Yes | No | Yes | Yes | No | Yes | Yes | Yes |
| Skrill | Yes | No | Yes | Yes | No | Yes | No | Yes |
| Payoneer | No | Yes | No | Yes | No | Yes | Yes | No |
| Neteller | Yes | Yes | Yes | Yes | Yes | Yes | Yes | Yes |
Find Moving Average Crossover with Round-the-clock support?
Effective customer service is an essential factor to consider when dealing with Moving Average Crossover.
Moving Average Crossover customer service entails various support services to aid customers in making the most cost-effective and appropriate use of the brokers' services.
The customer support options offered by Moving Average Crossover can include phone answering services, live chat support, and email customer service support.
IC Markets support a wide range of languages including English, Japanese, Chinese, Polish, Afrikans, Danish, Dutch, German and more
Roboforex support a wide range of languages including English, Chinese Simplified, Chinese Traditional, Indonesian, Malaysian, Portuguese, Spanish, Italian, Polish, Arabic, Thai, Russian, and Ukrainian
IC Markets and Roboforex offer support where clients are able to call or contact the helpdesk via email or a chat service.
| Broker |
IC Markets
|
Roboforex
|
eToro
|
XTB
|
XM
|
Pepperstone
|
AvaTrade
|
FP Markets
|
|---|---|---|---|---|---|---|---|---|
| Support |
|
|
|
|
|
|
|
|
| Languages | English, Japanese, Chinese, Polish, Afrikans, Danish, Dutch, German and more | English, Chinese Simplified, Chinese Traditional, Indonesian, Malaysian, Portuguese, Spanish, Italian, Polish, Arabic, Thai, Russian, and Ukrainian | English, German, Spanish, French, Italian | English, Spanish, Czech, Chinese, German, French, Italian, Polish, Portuguese, Romanian, Slovenian, and Turkish | Arabic, Chinese, English, French, German, Greek, Hindi, Hungarian, Indonesian, Italian, Japanese, Korean, Malay, Polish, Portuguese, Russian, Spanish, Swedish, Thai, and Turkish | English, Spanish, Portuguese, Thai, Russian, Italian, French, German, Polish, Chinese, Vietnamese, and Arabic | Arabic, Simplified Chinese, Traditional Chinese, Dutch, English, Finnish, French, German, Hungarian, Italian, Indonesian, Japanese, Mongolian, Polish, Portuguese, Russian, Spanish, Swedish, Thai, Malay, Korean and Turkish | English, Arabic, Indonesian, Italian, Spanish, French, Russian, Chinese, Japanese, German, Portuguese, Thai, French, Malay, Greek, Vietnamese, Romanian, Turkish, Slovenian, Dutch, Polish, Finnish, Norwegian, Swedish, Serbian, Lithuanian, Hungarian, Galician, Estonian, Danish, Czech, Croatian, Bulgarian, Basque |
| Learn More | Visit IC Markets | Visit Roboforex | Visit eToro | Visit XTB | Visit XM | Visit Pepperstone | Visit AvaTrade | Visit FP Markets |
| Risk Warning | Losses can exceed deposits | Losses can exceed deposits | 52% of retail investor accounts lose money when trading CFDs with this provider. | 69% - 80% of retail investor accounts lose money when trading CFDs with this provider. You should consider whether you understand how CFDs work and whether you can afford to take the high risk of losing your money. | CFDs are complex instruments and come with a high risk of losing money rapidly due to leverage. 74.48% of retail investor accounts lose money when trading CFDs with this provider. You should consider whether you understand how CFDs work and whether you can afford to take the high risk of losing your money. | 74-95 % of retail investor accounts lose money when trading CFDs | 57% of retail investor accounts lose money when trading CFDs with this provider | Losses can exceed deposits |
Make sure the Moving Average Crossover Offer Comprehensive Trader resources?
It's important to ensure your Moving Average Crossover provide complimentary resources such as analysis, education, and risk management tools. IC Markets and Roboforex collaborate with top analysts to bring the most up-to-date news and insights to traders.
Sound risk and money management are vital to financial market navigation with Moving Average Crossover. However, selecting the best broker to access the markets is a critical step that traders should not overlook as they embark on trading live financial markets with Moving Average Crossover.
Why Moving Average Crossover needs to be regulated?
Regulated Moving Average Crossover lowers your risk of loss of deposited trading funds.
Lowering your risk is one of the benefits of working with a properly regulated Moving Average Crossover.
Consumers are protected by Moving Average Crossover regulation, critical to preventing inadequate services and potential financial harm.
Regulation of Moving Average Crossover is necessary to prevent fraud. The Moving Average Crossover working capital and client-funded accounts must be kept separate to avoid conducting business with client funds. Any fraudulent behaviour with Moving Average Crossover is monitored by financial regulators in the jurisdictions brokers are allowed to operate.
Moving Average Crossover List
Funding methods
Bank transfer Credit Card PaypalPlatforms
MT5, MT4, MetaTrader WebTrader, Mobile Apps, iOS (App Store), Android (Google Play), MetaTrader iPhone/iPad, MetaTrader Android Google Play, MetaTrader Mac, cTrader, cTrader Web, cTrader iPhone/iPad, cTrader iMac, cTrader Android Google Play, cTrader Automate, cTrader Copy Trading, TradingView, Virtual Private Server, Trading Servers, MT4 Advanced Trading Tools, IC Insights, Trading CentralCustomer support
Live chat Phone support Email supportAccount Types
Micro account Standard account ECN accountIslamic account VIP account
Funding methods
Bank transfer Credit Card PaypalPlatforms
MT4, MT5, R Mobile Trader, R StocksTrader, WebTrader, Mobile Apps, iOS (App Store), Android (Google Play), WindowsCustomer support
Live chat Phone support Email supportAccount Types
Micro account Standard account ECN accountIslamic account VIP account
eToro is a multi-asset platform which offers both investing in stocks and cryptoassets, as well as trading CFDs.
Please note that CFDs are complex instruments and come with a high risk of losing money rapidly due to leverage. 52% of retail investor accounts lose money when trading CFDs with this provider. You should consider whether you understand how CFDs work, and whether you can afford to take the high risk of losing your money.
This communication is intended for information and educational purposes only and should not be considered investment advice or investment recommendation. Past performance is not an indication of future results.
Copy Trading does not amount to investment advice. The value of your investments may go up or down. Your capital is at risk.
Crypto investments are risky and may not suit retail investors; you could lose your entire investment. Understand the risks here.
Don't invest unless you're prepared to lose all the money you invest. This is a high-risk investment, and you should not expect to be protected if something goes wrong. Take 2 mins to learn more.
eToro USA LLC does not offer CFDs and makes no representation and assumes no liability as to the accuracy or completeness of the content of this publication, which has been prepared by our partner utilizing publicly available non-entity specific information about eToro.
Funding methods
Bank transfer Credit Card PaypalPlatforms
eToro Trading App, Mobile Apps, iOS (App Store), Android (Google Play), CopyTrading, WebCustomer support
Live chat Phone support Email supportAccount Types
Micro account Standard account ECN accountIslamic account VIP account
Funding methods
Bank transfer Credit Card PaypalPlatforms
MT4, Mirror Trader, Web Trader, Tablet, Mobile Apps, iOS (App Store), Android (Google Play)Customer support
Live chat Phone support Email supportAccount Types
Micro account Standard account ECN accountIslamic account VIP account
Funding methods
Bank transfer Credit Card PaypalPlatforms
MT5, MT5 WebTrader, XM Apple App for iPhone, XM App for Android Google Play, Tablet: MT5 for iPad, MT5 for Android Google Play, XM App for iPad, XM App for iOS (App Store), Android (Google Play), Mobile AppsCustomer support
Live chat Phone support Email supportAccount Types
Micro account Standard account ECN accountIslamic account XM Swap-Free account (XM Ultra Low Account) VIP account
Funding methods
Bank transfer Credit Card PaypalPlatforms
MT4, MT5, cTrader,WebTrader, TradingView, Windows, Mobile Apps, iOS (App Store), Android (Google Play)Customer support
Live chat Phone support Email supportAccount Types
Micro account Standard account ECN accountIslamic account Pro Account VIP account
Funding methods
Bank transfer Credit Card PaypalPlatforms
MT4, MT5, Web Trading, AvaTrade App, AvaOptions, Mac Trading, AvaSocial, Mobile Apps, iOS (App Store), Android (Google Play)Customer support
Live chat Phone support Email supportAccount Types
Micro account Standard account ECN accountIslamic account VIP account
Funding methods
Bank transfer Credit Card PaypalPlatforms
MT4, MT5, TradingView, cTrader, WebTrader, Mobile Trader, Mobile Apps, iOS (App Store), Android (Google Play)Customer support
Live chat Phone support Email supportAccount Types
Micro account Standard account ECN accountIslamic account VIP account
Funding methods
Bank transfer Credit Card PaypalPlatforms
easyMarkets App, Mobile Apps, iOS (App Store), Android (Google Play), Web Platform, TradingView, MT4, MT5Customer support
Live chat Phone support Email supportAccount Types
Micro account Standard account ECN accountIslamic account VIP account
Funding methods
Bank transfer Credit Card PaypalPlatforms
Web, Mobile Apps, iOS (App Store), Android (Google Play), iPad App, iPhone App, TradingViewCustomer support
Live chat Phone support Email supportAccount Types
Micro account Standard account ECN accountIslamic account VIP account
Funding methods
Bank transfer Credit Card PaypalPlatforms
MT4, MT5, cTrader, FxPro WebTrader, FxPro Mobile Apps, iOS (App Store), Android (Google Play)Customer support
Live chat Phone support Email supportAccount Types
Micro account Standard account ECN accountIslamic account VIP account

Learn more
Losses can exceed deposits

Losses can exceed deposits