Dow Jones Brokers for 2026
We found 11 online brokers that are appropriate for Trading Dow Jones Brokers Investment Platforms.
Dow Jones Brokers Guide
Analysis by Andrew Blumer, Updated and fact-checked by Senad Karaahmetovic, Last updated – December 30, 2025
Dow Jones Brokers
Dow Jones brokers provide traders with the opportunity to gain exposure to the Dow Jones Industrial Average (DJIA) index through various financial instruments rather than direct index trading. Since the index itself is not directly tradable, these brokers facilitate trading primarily via Exchange Traded Funds (ETFs) for example, the SPDR Dow Jones Industrial Average ETF Trust (ticker: DIA) or the iShares Dow Jones U.S. ETF (ticker: IYY) which track the performance of the Dow Jones Index.
In addition to ETFs, these brokers often offer leveraged trading options and the ability to short sell, allowing traders to capitalize on both rising and falling markets. For instance, a trader might use 2× leveraged Dow ETFs like the ProShares Ultra Dow30 (ticker: DDM) to magnify gains, or short sell CFDs on Dow futures. Many also provide access to Futures contracts such as E mini Dow Futures (YM) and Contracts for Differences (CFDs), which are popular derivatives used to speculate on the Dow Jones Index’s price movements. However, trading CFDs requires a solid understanding of margin requirements and the risks involved, such as potential margin calls if the market moves against your position.
CFD Dow Jones brokers typically equip their platforms with a wide array of trading tools and resources charts with technical indicators, economic calendars, and break even calculators often without charging commissions or additional fees on trades. Instead, their earnings come mainly from the spread the difference between the buying and selling price. For example, if the bid price for a Dow CFD is 34,800 and the ask price is 34,805, the spread is 5 points. The narrower the spread, the better it is for traders, but also the more profitable for the broker.
Traders should also be aware of other potential costs related to Dow Jones trading, such as management fees for ETFs or mutual funds (e.g., an annual expense ratio of 0.16% for DIA), bid ask spreads (slippage), and higher expenses tied to active trading strategies or futures contracts (including overnight financing fees on CFD positions). A clear understanding of these costs is vital for optimizing investment strategies and enhancing overall returns.
Best DJIA Brokers
Here are some notable brokers offering access to the Dow Jones Industrial Average (DJIA) through various trading instruments:
IC Markets
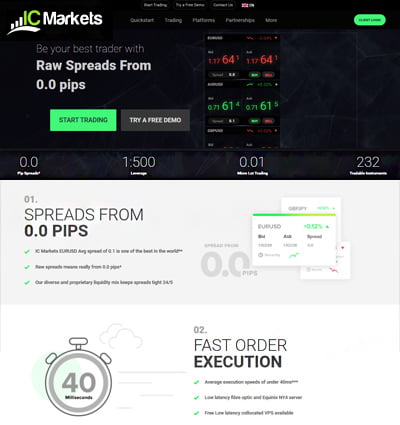
IC Markets is a top choice for traders seeking tight spreads and fast execution, especially when trading major indices like the Dow Jones. They offer CFDs on indices, allowing precise speculation on the Dow Jones Industrial Average (DJIA). Their platforms, including MT4, MT5, and cTrader, provide robust tools, low latency, and high execution speed, making them ideal for day traders and scalpers focused on DJIA CFDs.

RoboForex
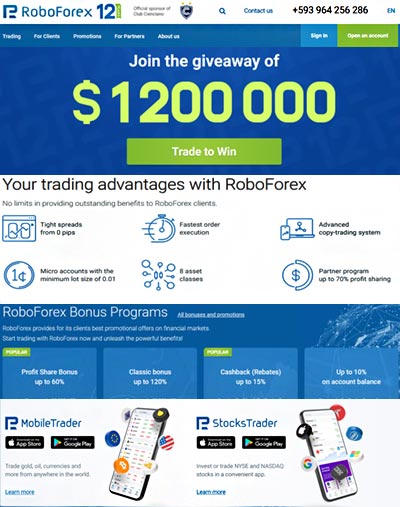
RoboForex provides a dynamic trading environment with access to a wide range of instruments, including CFDs on major indices like the Dow Jones. With ultra competitive spreads and high leverage options, traders can capitalize on short term market movements. RoboForex’s MT4 and MT5 platforms deliver flexibility and fast execution, making it well suited for speculative Dow Jones trading.

eToro

eToro is unique as a social trading platform where users can trade CFDs on indices like the Dow Jones Industrial Average. Traders can independently trade the DJIA or copy strategies from successful index traders. This combination of CFD trading and social features creates a community driven environment ideal for those interested in Dow Jones trading with social insights.

XTB
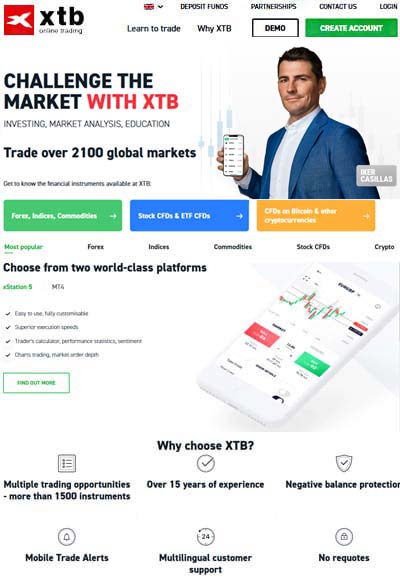
XTB is excellent for traders valuing in depth market analysis when trading indices like the Dow Jones. They provide CFDs on the DJIA with advanced research tools and educational resources. XTB’s platform supports traders keen to develop strategies and gain insights while speculating on major indices.

XM
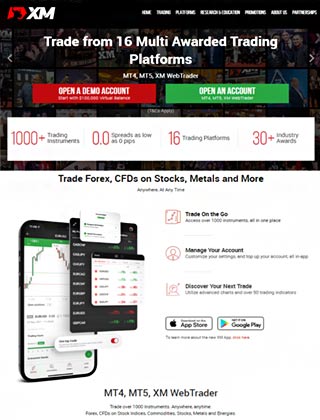
XM offers a robust platform for trading a broad range of financial instruments, including CFDs on major indices like the Dow Jones. With multiple account types and leverage options, supported by strong customer service and regulatory oversight, XM provides a well rounded environment for engaging with Dow Jones trading.

Pepperstone

Pepperstone offers comprehensive trading options, including CFDs on indices such as the Dow Jones. Their platforms are known for low spreads, fast execution, and reliable infrastructure. Pepperstone’s strong regulatory backing and diverse assets make it a dependable choice whether Dow Jones trading is your primary focus or part of a broader strategy.

AvaTrade
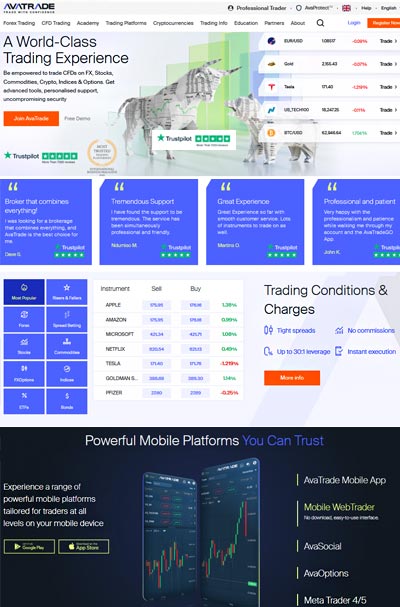
AvaTrade delivers a versatile platform for trading various instruments, including Dow Jones CFDs. Tools like AvaTradeGo and AvaSocial enhance the trading experience, supported by commission free trading and a wealth of educational resources. AvaTrade emphasizes flexibility and community engagement, appealing to traders interested in collaborative index trading.

FP Markets

FP Markets is a technology driven broker providing advanced MetaTrader 4 and 5 platforms with enhanced features for trading Dow Jones CFDs. Their competitive spreads and high performance tools cater to traders demanding precision and efficiency. FP Markets’ focus on technology and cost efficiency makes it a valuable option for Dow Jones index trading.

Understanding the Dow Jones Industrial Average and Its Significance
The Dow Jones Industrial Average (DJIA), commonly known as the Dow, is a key stock market index that tracks the performance of thirty major US blue chip companies. It serves as a barometer for the overall health of the US stock market and, by extension, the broader economy. For example, a surge in the Dow following positive GDP data often signals investor confidence, while a drop after weak retail sales can indicate economic slowdown.
Stock indexes like the DJIA track price movements of selected securities to represent specific markets or economies. While there are indexes covering everything from US equities (e.g., the S&P 500) to global bonds (e.g., the Bloomberg Global Aggregate), the DJIA stands out as one of the oldest and most widely recognized, having been established in 1896. For instance, on its first day it consisted of companies such as U.S. Leather and American Cotton Oil.
The index includes thirty large, well established corporations known for their long standing performance and significant market influence. Because of its history and the prominence of its components, the DJIA is frequently cited by financial analysts and the media when assessing market trends. Recent examples of components include Apple, JPMorgan Chase, and Coca Cola.
Many investors view a strong Dow as a reflection of a healthy economy, and vice versa. As economic conditions evolve, the DJIA’s composition is adjusted accordingly. Companies that no longer represent the current economic landscape often due to declining market capitalization or financial difficulties are removed and replaced with firms that better reflect ongoing economic trends. For example, in 2020 ExxonMobil was replaced by Amgen to reflect the shifting importance of healthcare.
Market capitalization plays a crucial role in many indexes as it measures a company’s total value by multiplying its outstanding shares by the stock price. In the DJIA, however, stocks with higher share prices exert more influence on the index’s movement than those with lower prices, which is a unique feature of this price weighted index. For example, a $10 move in a $300 stock like Goldman Sachs moves the Dow more than a $10 move in a $50 stock like Verizon.
History of the Dow Jones Industrial Average

Having followed U.S. markets since my first summer internship on Wall Street, I’ve always been fascinated by the Dow Jones Industrial Average (DJIA), established in May 1896 by Charles Dow and Edward Jones. As the second oldest U.S. market index coming two years after Dow’s own Transportation Average it began life as a staple in daily newspaper editorials, sitting alongside local weather and shipping bulletins in my grandfather’s hometown paper.
In its early years, the DJIA was populated largely by essential industrial names think sugar, railroads, cotton, gas, and oil. For example, American Sugar Refining and Chicago Gas were regulars, alongside Tennessee Coal & Iron companies whose boardrooms I later visited on a research trip to Birmingham.
Over the decades, I’ve watched the index grow from a half dozen to twelve stocks, then to twenty in 1916, and to thirty in 1928 where it stands today. On that expansion in ’28, household names like U.S. Steel and General Electric were added two firms I analyzed extensively during my years covering the industrial sector.
Through the turmoil of the Great Depression and the 2007to 2008 Recession, the Dow’s composition shifted dramatically. For instance, I remember noting in my 2003 research that Bethlehem Steel slipped off the list after its bankruptcy, and a few years later, Bank of America was brought in amidst the financial crisis—moves that reflected broader economic upheavals I studied firsthand.
Back then, the DJIA was simply an arithmetic average of its component prices, but corporate actions like stock splits and mergers made that approach impractical. Today’s methodology uses the Dow Divisor to neutralize those events. I saw this in action when Apple’s 4 for 1 split in 2020 prompted a divisor adjustment to keep the index level smooth an elegant fix I highlighted in my market commentary that week.

The Dow Divisor and Its Role
The Dow Divisor is a factor used to calculate the DJIA, initially set to the number of stocks in the index (thirty). It has since been adjusted to account for corporate actions like stock splits, spinoffs, and mergers. For instance, after Visa’s spin off from Fiserv in 2019, the divisor was changed.
The purpose of the divisor is to maintain the continuity of the index’s value over time, ensuring that such corporate events do not artificially alter the DJIA’s level. Without the divisor, a 2 for 1 split would halve a stock’s price and thus halve the Dow, which would be misleading.
For example, the divisor was 16.67 in 1928 and has decreased to approximately 0.147 as of September 2019. This constant adjustment keeps the DJIA reflective of true market conditions. As of June 2025, it stands around 0.152 after multiple corporate actions over the last decade.
By maintaining an accurate divisor, traders can rely on the DJIA as a meaningful indicator and make better informed decisions based on its movements. Many index futures contracts and ETFs, such as DIA, reference this calculation.
The Importance of the DJIA
The DJIA's influence stems largely from being the second oldest U.S. stock market index and its role in tracking major corporations such as Boeing, Coca Cola, and Microsoft. For example, when Microsoft reports strong quarterly earnings, the Dow often reflects that strength.
While it includes fewer stocks than many other indices, the DJIA represents the leading corporate giants of America. Its composition is regularly updated to reflect the rise and fall of different economic sectors. For instance, tech companies have grown in influence, leading to additions like Salesforce in 2020.
Many investors consider the DJIA a reliable barometer of the U.S. economy and a key indicator of the performance of major markets that influence it. Historically, a 10% decline in the Dow is labeled a “correction,” which can trigger market wide selling.
Changes to the index’s components when companies are added or removed often have noticeable effects on the market perception of those companies. When Nike joined the Dow in 2013, its share price rose on the news.
Dow Jones Sustainability Indices

The Dow Jones Sustainability Indices (DJSI) are variations of the DJIA that focus on environmental, social, and governance (ESG) investment criteria. These indices differ widely, with some targeting specific regions, such as the U.S., while others apply exclusions based on industry sectors. Examples include DJSI World, DJSI North America, and DJSI Europe.
For example, certain regional variants exclude companies involved in tobacco, firearms, or gambling to align with socially responsible investing principles. The DJSI U.S. excludes companies like Philip Morris and Lockheed Martin.
The Advantages of the DJIA
The DJIA offers several key advantages for investors and market participants, making it a widely used tool in finance and capital markets.
An Excellent Benchmark for Market Performance
The DJIA provides a convenient and reliable benchmark for tracking the overall performance and health of the U.S. stock market. Many mutual funds use it as a performance target.
Offers a Rich Historical Background
With a history spanning over a century, the DJIA offers valuable historical data that helps investors analyze long term trends and make more informed investment decisions, particularly for longer term strategies. For example, back testing using Dow data can guide portfolio allocation.
Represents Leading Blue Chip Companies
The DJIA tracks the performance of 30 major blue chip companies that are leaders in their industries, giving investors insight into the health of key sectors in the U.S. economy. Examples include Visa in financials and Home Depot in consumer discretionary.
Simplicity and Accessibility
Unlike broader indexes, the DJIA’s focus on just 30 stocks makes it easy to understand and follow for both novice and experienced investors. Websites and financial news outlets update Dow levels in real time.
Influences Market Sentiment
Because of its prominence, the DJIA often shapes investor sentiment and media coverage, influencing how markets react to economic news and corporate developments. A jump of 500 points in the Dow typically headlines major news outlets.

The Disadvantages Of DJIA
Despite its benefits, Dow investors must also be aware of some of its weaknesses as outlined below:
Only Traces A Small Number Of Sectors And Stocks
The DJIA tracks only thirty U.S. stocks and does not cover all economic sectors. For example, it includes just nine sectors excluding utilities and transportation, limiting its representation of the broader market diversity. Industries like real estate and biotech are underrepresented.
Only Accounts For Prominent Corporations
Since the DJIA focuses exclusively on major, blue chip companies, it overlooks a significant portion of the U.S. stock market made up of small cap and mid cap stocks, which can lead to an incomplete picture of overall market performance. For instance, small cap rally in 2021 was not captured by the Dow.
Price Weighting Is Often Misleading
Because the DJIA is price weighted, stocks with higher share prices disproportionately influence the index's movement, regardless of their actual market capitalization or economic impact, which can distort its true representation of market trends. For example, a $1 move in a $400 stock affects the Dow more than a $10 move in a $40 stock.
Lack Of Sector Balance
The index’s composition may become skewed toward certain industries, especially when some sectors dominate in market capitalization or stock prices, potentially giving an unbalanced view of the economy’s overall health. In 2020, tech made up nearly 30% of the index’s price weight.
Not Reflective Of Market Capitalization
Unlike market cap weighted indexes, the DJIA does not factor in the size of companies by market capitalization, meaning larger companies with significant economic influence may have less impact on the index compared to smaller companies with higher stock prices. For example, Amazon’s large market cap is under weighted because of its lower share price after splits.
DJIA Vs NASDAQ Vs S&P 500
| Feature | DJIA | NASDAQ | S&P 500 |
|---|---|---|---|
| Established | 1896, one of the oldest U.S. market indexes | 1971, first electronic stock market | 1957, newer than DJIA but widely followed |
| Number of Stocks | 30 large, blue chip companies | Over 4,000 stocks, including tech heavy companies | 500 major publicly traded companies |
| Type of Index | Price weighted average | Market cap weighted composite index | Free float adjusted market cap weighted index |
| Market Coverage | Focuses on prominent, mostly industrial and large cap firms | Includes a broad range of stocks, tech sector heavy | Broad market representation across sectors |
| Trading | Index itself is not tradable, but funds tracking it are | Represents stocks traded on the NASDAQ exchange | Index funds and ETFs widely traded tracking this index |
| Significance | Most viewed, serves as a barometer for U.S. blue chip stocks | Known for technology stocks and innovation | Considered the best indicator of overall U.S. market health |

How to Choose the Right DJIA Broker:
- Trading Fees: Compare commissions and spreads specifically for DJIA instruments.
- Example: Interactive Brokers offers $0.85 per E mini Dow (YM) futures contract side, while IC Markets Charges a 1 to 2 point spread on Dow CFDs.
- Check for platform fees, inactivity charges, and data feed subscriptions for real time DJIA quotes.
- Platform and Tools: Ensure the broker’s platform provides robust tools for index traders.
- Example: Thinkorswim by TD Ameritrade offers advanced chart studies (e.g., VWAP, MACD) and Dow specific scanners to identify breakouts in DJIA components.
- Look for depth of market (DOM) views on mini Dow futures and integrated economic calendars with U.S. GDP and nonfarm payroll release alerts.
- Research and Education: Access to DJIA focused analysis can be a game changer.
- Example: XTB publishes daily Dow Jones Newswires commentary, while eToro offers in platform webinars on DJIA technical setups.
- Check for back testing modules that let you test strategies on the past 10 years of Dow data, and educational materials on trading index options (e.g., DIA calls and puts).
- Customer Service: You need responsive support when timing DJIA moves.
- Example: IC Markets provides 24/5 live chat with dedicated index trading specialists; Fidelity offers phone support during U.S. market hours.
- Verify whether they can assist with margin calls on Dow futures or guide you through ETF block trades in DIA.
- Account Types and Minimums: Different account levels can affect your DJIA trading costs.
- Example: Interactive Brokers requires a $2,000 minimum for a margin account to trade E mini Dow (YM), whereas TradeStation has no minimum for cash accounts trading DIA ETFs.
- Check if the broker offers VIP tiers with reduced futures margins (e.g., 2% initial margin on YM) or lower ETF expense waivers.
Selecting the right broker for DJIA trading involves balancing low costs on E mini Dow futures or CFDs, powerful charting and order entry tools, timely Dow focused research, responsive support during U.S. market hours, and account terms that fit your trading style and capital.
Can You Buy the Dow Jones Industrial Average Directly?
You cannot purchase the DJIA itself since it’s an index, not a stock. However, traders can gain direct exposure to DJIA moves through several tailored instruments:
Buying Shares of All Thirty Companies in the DJIA
You can assemble a “DIY Dow” by buying each component stock: Apple (AAPL), Boeing (BA), Goldman Sachs (GS), etc. Pros: Full control over weightings; no ETF expense ratio. Cons: Must rebalance when the index updates e.g., when Honeywell replaced Raytheon in August 2020.
Trading DJIA Futures or Options
E mini Dow futures (symbol YM) and options trade on CME Globex, each YM tick is 1 index point = $5. Example: A 100 point move equals $500 per contract. Futures offer 24 hour access, margin of roughly $6,000 per contract, and tight spreads (often 0.5 to 1 point). Risks: Leverage can amplify both gains and losses.
Buying Shares of a DJIA Based ETF
ETFs like DIA (SPDR Dow Jones Industrial Average ETF) or DJD (ProShares UltraShort Dow30) let you trade one ticker for broad index exposure. Pros: Easy to trade during U.S. market hours; automatic rebalancing; dividends passed through. Cons: Annual expense ratios (DIA is 0.16%), possible tracking error, and less precise leverage than futures.
Dow Jones Brokers Verdict
The current level of the DJIA at 42,762.87(June 2025) reflects the overall health and sentiment of the U.S. stock market and economy. As one of the oldest and most recognized stock market indexes, the DJIA serves as a key benchmark for investors and analysts to gauge market trends, especially focusing on thirty prominent blue chip companies.
While the DJIA offers valuable insights and a rich historical perspective, it is important to remember its limitations. The index only tracks thirty large cap stocks, which means it doesn't capture the full breadth of the U.S. market or all economic sectors. Additionally, its price weighted methodology can sometimes misrepresent the true market influence of certain companies.
From my experience trading the Dow Jones Industrial Average through specialized brokers, the easiest way to gain exposure is via ETFs like SPDR’s DIA or iShares’ IYY. These products track the DJIA’s performance closely, and I’ve found their liquidity and low expense ratios (around 0.16% for DIA) make them a practical choice for both long term investing and tactical market plays.
For more aggressive strategies, I’ve used 2× leveraged ETFs (e.g., ProShares Ultra Dow30 DDM) and CFD platforms that let me go both long and short. The ability to trade E mini Dow futures (YM) or CFDs with tight spreads often just a few points has amplified returns, though it also taught me the importance of strict risk controls and awareness of margin calls when the market moves against you.
I’ve appreciated brokers like IC Markets and RoboForex for their ultra competitive spreads on DJIA CFDs, and eToro’s social trading feature for getting real time insights from other Dow traders. What stood out was the combination of advanced charting tools, economic calendars, and break even calculators, which helped me fine tune entries and exits around major U.S. data releases.
Overall, choosing the right Dow Jones broker comes down to balancing cost (spreads, commissions, overnight fees), platform reliability, research support, and regulatory security. In my hands on experience, a broker that offers clear fee structures, responsive customer service, and access to both ETFs and derivative instruments has been key to navigating the DJIA’s volatility with confidence.
For investors seeking exposure to the Dow, there are practical options such as buying shares of the individual companies, investing in DJIA based ETFs, or trading futures and options, each with their own benefits and risks.
Personally, I find the DJIA’s long history and status as a market icon make it an essential reference point. However, I always complement it with broader indexes like the S&P 500 or NASDAQ to get a more comprehensive view of the market.
We have conducted extensive research and analysis on over multiple data points on Dow Jones Brokers to present you with a comprehensive guide that can help you find the most suitable Dow Jones Brokers. Below we shortlist what we think are the best Dow Jones Brokers Investment Platforms after careful consideration and evaluation. We hope this list will assist you in making an informed decision when researching Dow Jones Brokers.
Reputable Dow Jones Brokers Checklist
Selecting a reliable and reputable online Dow Jones Brokers Investment Platforms trading brokerage involves assessing their track record, regulatory status, customer support, processing times, international presence, and language capabilities. Considering these factors, you can make an informed decision and trade Dow Jones Brokers Investment Platforms more confidently.
Selecting the right online Dow Jones Brokers Investment Platforms trading brokerage requires careful consideration of several critical factors. Here are some essential points to keep in mind:
- Ensure your chosen Dow Jones Brokers Investment Platforms broker has a solid track record of at least two years in the industry.
- Verify that the Dow Jones Brokers Investment Platforms broker has a customer support team of at least 15 members responsive to queries and concerns.
- Check if the Dow Jones Brokers Investment Platforms broker operates under the regulatory framework of a jurisdiction that can hold it accountable for any misconduct or resolve disputes fairly and impartially.
- Ensure that the Dow Jones Brokers Investment Platforms broker can process deposits and withdrawals within two to three days, which is crucial when you need to access your funds quickly.
- Look for Dow Jones Brokers Investment Platforms brokers with an international presence in multiple countries, offering its clients local seminars and training programs.
- Ensure the Dow Jones Brokers Investment Platforms broker can hire staff from diverse locations worldwide who can communicate fluently in your local language.
Our team have listed brokers that match your criteria for you below. All brokerage data has been summarised into a comparison table. Scroll down.
Compare Key Features of Dow Jones Brokers Investment Platforms in Our Brokerage Comparison Table
When choosing a broker for Dow Jones Brokers Investment Platforms trading, it's essential to compare the different options available to you. Our Dow Jones Brokers Investment Platforms brokerage comparison table below allows you to compare several important features side by side, making it easier to make an informed choice.
- Minimum deposit requirement for opening an account with each Dow Jones Brokers Investment Platforms broker.
- The funding methods available for Dow Jones Brokers Investment Platforms with each broker.
- The types of instruments you can trade with each Dow Jones Brokers Investment Platforms broker, such as forex, stocks, commodities, and indices.
- The trading platforms each Dow Jones Brokers Investment Platforms broker provides, including their features, ease of use, and compatibility with your devices.
- The spread type (if applicable) for each Dow Jones Brokers Investment Platforms broker affects the cost of trading.
- The level of customer support each Dow Jones Brokers Investment Platforms broker offers, including their availability, responsiveness, and quality of service.
- Whether each Dow Jones Brokers Investment Platforms broker offers Micro, Standard, VIP, or Islamic accounts to suit your trading style and preferences.
By comparing these essential features, you can choose a Dow Jones Brokers Investment Platforms broker that best suits your needs and preferences for Dow Jones Brokers Investment Platforms. Our Dow Jones Brokers Investment Platforms broker comparison table simplifies the process, allowing you to make a more informed decision.
Top 15 Dow Jones Brokers Investment Platforms of 2026 compared
Here are the top Dow Jones Brokers Investment Platforms.
Compare Dow Jones Brokers Investment Platforms brokers for min deposits, funding, used by, benefits, account types, platforms, and support levels. When searching for a Dow Jones Brokers Investment Platforms broker, it's crucial to compare several factors to choose the right one for your Dow Jones Brokers Investment Platforms needs. Our comparison tool allows you to compare the essential features side by side.
All brokers below are Dow Jones Brokers Investment Platforms. Learn more about what they offer below.
You can scroll left and right on the comparison table below to see more Dow Jones Brokers Investment Platforms that accept Dow Jones Brokers Investment Platforms clients.
| Broker |
IC Markets

|
Roboforex

|
eToro

|
XTB

|
XM

|
Pepperstone

|
AvaTrade

|
FP Markets

|
EasyMarkets

|
SpreadEx

|
FXPro

|
|---|---|---|---|---|---|---|---|---|---|---|---|
| Rating | |||||||||||
| Regulation | International Capital Markets Pty Ltd (Australia) (ASIC) Australian Securities & Investments Commission Licence No. 335692, Seychelles Financial Services Authority (FSA) (SD018), IC Markets (EU) Ltd (CySEC) Cyprus Securities and Exchange Commission with License No. 362/18, Capital Markets Authority(CMA) Kenya IC Markets (KE) Ltd, Securities Commission of The Bahamas (SCB) IC Markets (Bahamas) Ltd | RoboForex Ltd is authorised and regulated by the Financial Services Commission (FSC) of Belize under licence No. 000138/32, under the Securities Industry Act 2021, RoboForex Ltd is an (A category) member of The Financial Commission, also RoboForex Ltd is a participant of the Financial Commission Compensation Fund | FCA (Financial Conduct Authority) eToro (UK) Ltd (FCA reference 583263), eToro (Europe) Ltd CySEC (Cyprus Securities Exchange Commission), ASIC (Australian Securities and Investments Commission) eToro AUS Capital Limited ASIC license 491139, CySec (Cyprus Securities and Exchange Commission under the license 109/10), FSAS (Financial Services Authority Seychelles) eToro (Seychelles) Ltd license SD076, eToro (ME) Limited (ADGM) Abu Dhabi (UAE) number 220073, eToro (Europe) Ltd (AMF) Autorité des marchés financiers as a digital assets provider France | FCA (Financial Conduct Authority reference 522157) XTB Limited, CySEC (Cyprus Securities and Exchange Commission reference 169/12), DFSA (Dubai Financial Services Authority XTB MENA Limited licensed 8 July 2021), FSA (Financial Services Authority Seychelles license number SD148), FSCA (Financial Sector Conduct Authority XTB Africa (Pty) Ltd licensed 10 August 2021), KNF (Komisja Nadzoru Finansowego Polish Financial Supervision Authority) | Financial Sector Conduct Authority (FSCA) (49976) XM ZA (Pty) Ltd, Financial Services Commission (FSC) (000261/27) XM Global Limited, Cyprus Securities and Exchange Commission (CySEC) (license 120/10) Trading Point of Financial Instruments Ltd, Australian Securities and Investments Commission (ASIC) (number 443670) Trading Point of Financial Instruments Pty Ltd | Financial Conduct Authority (FCA), Australian Securities and Investments Commission (ASIC), Cyprus Securities and Exchange Commission (CySEC), Federal Financial Supervisory Authority (BaFin), Dubai Financial Services Authority (DFSA), Capital Markets Authority of Kenya (CMA), Pepperstone Markets Limited is incorporated in The Bahamas (number 177174 B), Licensed by the Securities Commission of The Bahamas (SCB) number SIA-F217 | Australian Securities and Investments Commission (ASIC) Ava Capital Markets Australia Pty Ltd (406684), South African Financial Sector Conduct Authority (FSCA) Ava Capital Markets Pty Ltd (45984), Financial Services Agency (Japan FSA) Ava Trade Japan K.K. (1662), Financial Futures Association of Japan (FFAJ) Ava Trade Japan K.K. (1574), Abu Dhabi Global Markets (ADGM) / Financial Regulatory Services Authority (FRSA) Ava Trade Middle East Ltd (190018), Central Bank of Ireland (C53877) AVA Trade EU Ltd, Polish Financial Supervision Authority (KNF) AVA Trade EU Ltd (branch authorisation), British Virgin Islands Financial Services Commission (BVI) Ava Trade Markets Ltd (SIBA/L/13/1049), Israel Securities Authority (ISA) ATrade Ltd (514666577) | CySEC (Cyprus Securities and Exchange Commission) (371/18), ASIC AFS (Australian Securities and Investments Commission) (286354), FSP (Financial Sector Conduct Authority in South Africa) (50926), Financial Services Authority Seychelles (FSA) (SD 130) | Easy Forex Trading Ltd is regulated by CySEC (License Number 079/07). Easy Forex Trading Ltd is the only entity that onboards EU clients, easyMarkets Pty Ltd is regulated by ASIC (AFS License No. 246566), EF Worldwide Ltd in Seychelles is regulated by FSA (License Number SD056), EF Worldwide Ltd in the British Virgin Islands is regulated by FSC (License Number SIBA/L/20/1135) | FCA (Financial Conduct Authority) (190941), Gambling Commission (Great Britain) (8835), licence in Ireland as remote bookmaker for fixed odds betting licence number 1016176 | FCA (Financial Conduct Authority) (509956), CySEC (Cyprus Securities and Exchange Commission) (078/07), FSCA (Financial Sector Conduct Authority) (45052), SCB (Securities Commission of The Bahamas) (SIA-F184), FSA (Financial Services Authority of Seychelles) (SD120) |
| Min Deposit | 200 | 10 | 50 | No minimum deposit | 5 | No minimum deposit | 100 | 100 | 25 | No minimum deposit | 100 |
| Funding |
|
|
|
|
|
|
|
|
|
|
|
| Used By | 200,000+ | 730,000+ | 40,000,000+ | 2,000,000+ | 15,000,000+ | 750,000+ | 400,000+ | 200,000+ | 250,000+ | 60,000+ | 11,200,000+ |
| Benefits |
|
|
|
|
|
|
|
|
|
|
|
| Accounts |
|
|
|
|
|
|
|
|
|
|
|
| Platforms | MT5, MT4, MetaTrader WebTrader, Mobile Apps, iOS (App Store), Android (Google Play), MetaTrader iPhone/iPad, MetaTrader Android Google Play, MetaTrader Mac, cTrader, cTrader Web, cTrader iPhone/iPad, cTrader iMac, cTrader Android Google Play, cTrader Automate, cTrader Copy Trading, TradingView, Virtual Private Server, Trading Servers, MT4 Advanced Trading Tools, IC Insights, Trading Central | MT4, MT5, R Mobile Trader, R StocksTrader, WebTrader, Mobile Apps, iOS (App Store), Android (Google Play), Windows | eToro Trading App, Mobile Apps, iOS (App Store), Android (Google Play), CopyTrading, Web | MT4, Mirror Trader, Web Trader, Tablet, Mobile Apps, iOS (App Store), Android (Google Play) | MT5, MT5 WebTrader, XM Apple App for iPhone, XM App for Android Google Play, Tablet: MT5 for iPad, MT5 for Android Google Play, XM App for iPad, XM App for iOS (App Store), Android (Google Play), Mobile Apps | MT4, MT5, cTrader,WebTrader, TradingView, Windows, Mobile Apps, iOS (App Store), Android (Google Play) | MT4, MT5, Web Trading, AvaTrade App, AvaOptions, Mac Trading, AvaSocial, Mobile Apps, iOS (App Store), Android (Google Play) | MT4, MT5, TradingView, cTrader, WebTrader, Mobile Trader, Mobile Apps, iOS (App Store), Android (Google Play) | easyMarkets App, Mobile Apps, iOS (App Store), Android (Google Play), Web Platform, TradingView, MT4, MT5 | Web, Mobile Apps, iOS (App Store), Android (Google Play), iPad App, iPhone App, TradingView | MT4, MT5, cTrader, FxPro WebTrader, FxPro Mobile Apps, iOS (App Store), Android (Google Play) |
| Support |
|
|
|
|
|
|
|
|
|
|
|
| Learn More |
Sign
Up with icmarkets |
Sign
Up with roboforex |
Sign
Up with etoro |
Sign
Up with xtb |
Sign
Up with xm |
Sign
Up with pepperstone |
Sign
Up with avatrade |
Sign
Up with fpmarkets |
Sign
Up with easymarkets |
Sign
Up with spreadex |
Sign
Up with fxpro |
| Risk Warning | Losses can exceed deposits | Losses can exceed deposits | 46% of retail investor accounts lose money when trading CFDs with this provider. | 69% - 80% of retail investor accounts lose money when trading CFDs with this provider. You should consider whether you understand how CFDs work and whether you can afford to take the high risk of losing your money. | CFDs are complex instruments and come with a high risk of losing money rapidly due to leverage. 75.99% of retail investor accounts lose money when trading CFDs with this provider. You should consider whether you understand how CFDs work and whether you can afford to take the high risk of losing your money. | 72-95 % of retail investor accounts lose money when trading CFDs | 57% of retail investor accounts lose money when trading CFDs with this provider | Losses can exceed deposits | Your capital is at risk | 62% of retail CFD accounts lose money | 74% of retail investor accounts lose money when trading CFDs and Spread Betting with this provider |
| Demo |
IC Markets Demo |
Roboforex Demo |
eToro Demo |
XTB Demo |
XM Demo |
Pepperstone Demo |
AvaTrade Demo |
FP Markets Demo |
easyMarkets Demo |
SpreadEx Demo |
FxPro Demo |
| Excluded Countries | US, IR, CA, NZ, JP | AU, BE, BQ, BR, CA, CW, CZ, DE, ES, EE, EU, FM, FR, FI, GW, ID, IR, JP, LR, MP, NL, PF, PL, RU, SE, SJ, SS, SL, SI, TL, TR, DO, US, IT, AT, PT, BG, HR, CY, DK, FL, GR, IE, LV, LT, MT, RO, SK, CH | ZA, ID, IR, KP, BE, CA, JP, SY, TR, IL, BY, AL, MD, MK, RS, GN, CD, SD, SA, ZW, ET, GH, TZ, LY, UG, ZM, BW, RW, TN, SO, NA, TG, SL, LR, GM, DJ, CI, PK, BN, TW, WS, NP, SG, VI, TM, TJ, UZ, LK, TT, HT, MM, BT, MH, MV, MG, MK, KZ, GD, FJ, PT, BB, BM, BS, AG, AI, AW, AX, LB, SV, PY, HN, GT, PR, NI, VG, AN, CN, BZ, DZ, MY, KH, PH, VN, EG, MN, MO, UA, JO, KR, AO, BR, HR, GL, IS, IM, JM, FM, MC, NG, SI, | US, IN, PK, BD, NG , ID, BE, AU | US, CA, IL, IR | AF, AS, AQ, AM, AZ, BY, BE, BZ, BT, BA, BI, CM, CA, CF, TD, CG, CI, ER, GF, PF, GP, GU, GN, GW, GY, HT, VA, IR, IQ, JP, KZ, LB, LR, LY, ML, MQ, YT, MZ, MM, NZ, NI, KP, PS, PR, RE, KN, LC, VC, WS, SO, GS, KR, SS, SD, SR, SY, TJ, TN, TM, TC, US, VU, VG, EH, ES, YE, ZW, ET | BE, BR, KP, NZ, TR, US, CA, SG | US, JP, NZ | US, IL, BC, MB, QC, ON, AF, BY, BI, KH, KY, TD, KM, CG, CU, CD, GQ, ER, FJ, GN, GW, HT, IR, IQ, LA, LY, MZ, MM, NI, KP, PW, PA, RU, SO, SS, SD, SY, TT, TM, VU, VE, YE | US, TR | US, CA, IR |
All Dow Jones Brokers Investment Platforms in more detail
You can compare Dow Jones Brokers Investment Platforms ratings, min deposits what the the broker offers, funding methods, platforms, spread types, customer support options, regulation and account types side by side.
We also have an indepth Top Dow Jones Brokers Investment Platforms for 2026 article further below. You can see it now by clicking here
We have listed top Dow Jones Brokers Investment Platforms below.
Dow Jones Brokers List

Funding methods
Bank transfer Credit Card PaypalPlatforms
MT5, MT4, MetaTrader WebTrader, Mobile Apps, iOS (App Store), Android (Google Play), MetaTrader iPhone/iPad, MetaTrader Android Google Play, MetaTrader Mac, cTrader, cTrader Web, cTrader iPhone/iPad, cTrader iMac, cTrader Android Google Play, cTrader Automate, cTrader Copy Trading, TradingView, Virtual Private Server, Trading Servers, MT4 Advanced Trading Tools, IC Insights, Trading CentralCustomer support
Live chat Phone support Email supportAccount Types
Micro account Standard account ECN accountIslamic account VIP account

Funding methods
Bank transfer Credit Card PaypalPlatforms
MT4, MT5, R Mobile Trader, R StocksTrader, WebTrader, Mobile Apps, iOS (App Store), Android (Google Play), WindowsCustomer support
Live chat Phone support Email supportAccount Types
Micro account Standard account ECN accountIslamic account VIP account

eToro is a multi-asset platform which offers both investing in stocks and cryptoassets, as well as trading CFDs.
Please note that CFDs are complex instruments and come with a high risk of losing money rapidly due to leverage. 46% of retail investor accounts lose money when trading CFDs with this provider. You should consider whether you understand how CFDs work, and whether you can afford to take the high risk of losing your money.
This communication is intended for information and educational purposes only and should not be considered investment advice or investment recommendation. Past performance is not an indication of future results.
Copy Trading does not amount to investment advice. The value of your investments may go up or down. Your capital is at risk.
Crypto investments are risky and may not suit retail investors; you could lose your entire investment. Understand the risks here.
Don't invest unless you're prepared to lose all the money you invest. This is a high-risk investment, and you should not expect to be protected if something goes wrong. Take 2 mins to learn more.
eToro USA LLC does not offer CFDs and makes no representation and assumes no liability as to the accuracy or completeness of the content of this publication, which has been prepared by our partner utilizing publicly available non-entity specific information about eToro.
Funding methods
Bank transfer Credit Card PaypalPlatforms
eToro Trading App, Mobile Apps, iOS (App Store), Android (Google Play), CopyTrading, WebCustomer support
Live chat Phone support Email supportAccount Types
Micro account Standard account ECN accountIslamic account VIP account

Funding methods
Bank transfer Credit Card PaypalPlatforms
MT4, Mirror Trader, Web Trader, Tablet, Mobile Apps, iOS (App Store), Android (Google Play)Customer support
Live chat Phone support Email supportAccount Types
Micro account Standard account ECN accountIslamic account VIP account

Funding methods
Bank transfer Credit Card PaypalPlatforms
MT5, MT5 WebTrader, XM Apple App for iPhone, XM App for Android Google Play, Tablet: MT5 for iPad, MT5 for Android Google Play, XM App for iPad, XM App for iOS (App Store), Android (Google Play), Mobile AppsCustomer support
Live chat Phone support Email supportAccount Types
Micro account Standard account ECN accountIslamic account XM Swap-Free account (XM Ultra Low Account) VIP account

Funding methods
Bank transfer Credit Card PaypalPlatforms
MT4, MT5, cTrader,WebTrader, TradingView, Windows, Mobile Apps, iOS (App Store), Android (Google Play)Customer support
Live chat Phone support Email supportAccount Types
Micro account Standard account ECN accountIslamic account Pro Account VIP account

Funding methods
Bank transfer Credit Card PaypalPlatforms
MT4, MT5, Web Trading, AvaTrade App, AvaOptions, Mac Trading, AvaSocial, Mobile Apps, iOS (App Store), Android (Google Play)Customer support
Live chat Phone support Email supportAccount Types
Micro account Standard account ECN accountIslamic account VIP account

Funding methods
Bank transfer Credit Card PaypalPlatforms
MT4, MT5, TradingView, cTrader, WebTrader, Mobile Trader, Mobile Apps, iOS (App Store), Android (Google Play)Customer support
Live chat Phone support Email supportAccount Types
Micro account Standard account ECN accountIslamic account VIP account

Funding methods
Bank transfer Credit Card PaypalPlatforms
easyMarkets App, Mobile Apps, iOS (App Store), Android (Google Play), Web Platform, TradingView, MT4, MT5Customer support
Live chat Phone support Email supportAccount Types
Micro account Standard account ECN accountIslamic account VIP account

Funding methods
Bank transfer Credit Card PaypalPlatforms
Web, Mobile Apps, iOS (App Store), Android (Google Play), iPad App, iPhone App, TradingViewCustomer support
Live chat Phone support Email supportAccount Types
Micro account Standard account ECN accountIslamic account VIP account

Funding methods
Bank transfer Credit Card PaypalPlatforms
MT4, MT5, cTrader, FxPro WebTrader, FxPro Mobile Apps, iOS (App Store), Android (Google Play)Customer support
Live chat Phone support Email supportAccount Types
Micro account Standard account ECN accountIslamic account VIP account
Learn more
 Losses can exceed deposits
Losses can exceed deposits