All Time High Stocks for 2025
We found 11 online brokers that are appropriate for Trading Stocks Investment Platforms.
All Time High Stocks Guide
Analysis by Andrew Blumer, Updated Last updated – July 09, 2025
All Time High Stocks

You have probably heard it many times that 'XYZ stock has hit an all-time high.' What does it mean? Well, in simple terms, it means the price of a stock is trading at a record high level. A level that was not seen before in the history of that specific stock.
Usually, an uptrend can be classified into different phases. A trader needs a different strategy for each phase, especially when a stock price reaches an all-time high, which was not seen in its entire trading history. To trade a stock like this at such a price, one needs special money management and entry/exit rules to protect the capital.
What makes a stock reach a high price which was not achieved before? To put it simply, a huge amount of buyers with virtually minimum sellers can result in a stock that reaches uncharted territory. This oversupply of buyers means that the sentiment of a stock is very bullish.
Buying a stock that is trading at a high price can be both rewarding and risky. Rewarding in the sense that you join a group of buyers who are currently dominating the market. Buying in a strong uptrend means a good chance that the price will keep going higher. But it can also be risky in case of a sell-off. In such a scenario, the stock can take a sharp U-turn and start trading lower and lower. Most traders usually get stuck by buying at record heights with no specific timeframe for when the stock will reach those levels again.
Finding a resistance level of such stocks can also prove to be difficult. With no previous history, one can only imagine hidden resistances from where the price can break out or take a reversal.
With the correct strategy, one can trade the stocks which are witnessing record heights. Let's take a look at the steps to ensure that odds are in your favor when trading such stocks.
The Process Of Breakout
Any breakout of a stock which propels it to new highs can be categorized into 3 phases. In 1st phase, the price rises above a resistance level with strong momentum and volume. This can be called the 'action phase' or 'step 1'.
In the 2nd phase, new selling pressure appears, which drives the price down to the last resistance level, which now acts as a support. This can be called the 'reaction phase' or 'step 2'. At this phase, it becomes clear if the breakout was real or just a trap for traders. At this phase, the resistance turned support must stop the fall of a share.
In the 3rd phase, the stock must find buyers at the support zone. If that happens and the buyers emerge victorious in the battle with sellers, a strong uptrend rally takes place. Once the stock price breaks above the last high, it signifies a continuation of the uptrend. This phase can be called 'step 3'.
Once the price breaks above the high of step 2 in the third phase, that's when one can safely enter as the price has already tested support in step 2.
One can buy at new heights in the breakout strategy as long as the price has tested a resistance turned support and safely bounced off it.
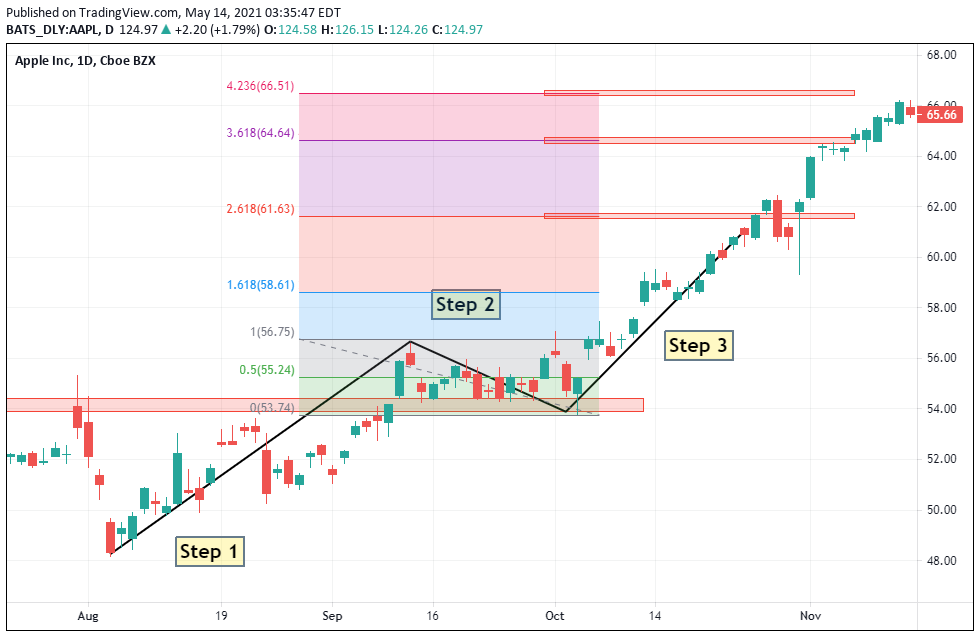
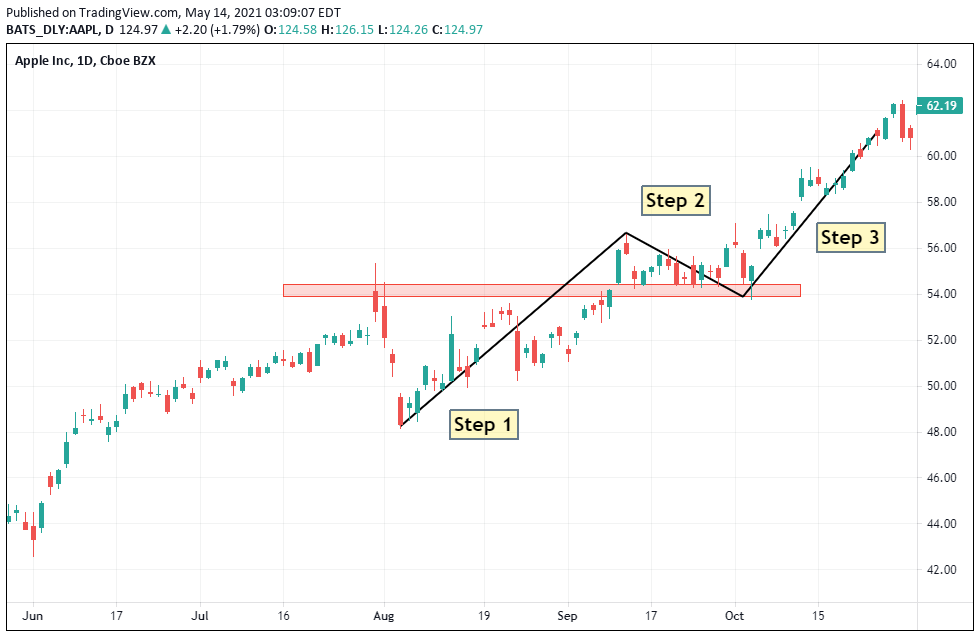
In this chart of 'AAPL,' the price closed above the resistance level of $54. That was 'step 1'.
In the '2nd step', the price returned to the $54 level. This time, the previous resistance was now acting as a support. As a result, AAPL found new buyers at the $54 level and went beyond the high of the 2nd step, which was around $56.
A candle close above the $56 in 'step 3' showed the final step of breakout. Buying a stock that has performed all the 3 steps before reaching a new height is considerably safer to trade. On the other hand, buying a stock that never went down to retest a previous price level can prove to be a high-risk move.
Finding Hidden Resistances
One of the major disadvantages of trading at new heights is no previously established resistance zones. In such a scenario, how can a trader find upcoming hidden resistances? The answer is the Fibonacci grid tool. Simply drawing a 'Fibonacci retracement tool' on the downtrend of 'step 2' can show us upcoming hidden resistances.
On the 'AAPL' chart, we can see future resistances at $61.63, $64.64, and $66.51. The chart also shows how the prices reached the hidden levels revealed by the Fibonacci retracement tool.
These resistance levels can be used for partial take-profit or completely closing a position.
However, for a long-term buy-and-hold strategy, selling at these Fibonacci levels is not a requirement.
Another way to take advantage of these levels is to wait until a price break above resistance level & then comes back to retest it as a support. In this scenario, a trader can add additional exposure at these levels.
We have conducted extensive research and analysis on over multiple data points on All Time High Stocks to present you with a comprehensive guide that can help you find the most suitable All Time High Stocks. Below we shortlist what we think are the best Stocks Investment Platforms after careful consideration and evaluation. We hope this list will assist you in making an informed decision when researching All Time High Stocks.
Reputable All Time High Stocks Checklist
Selecting a reliable and reputable online Stocks Investment Platforms trading brokerage involves assessing their track record, regulatory status, customer support, processing times, international presence, and language capabilities. Considering these factors, you can make an informed decision and trade Stocks Investment Platforms more confidently.
Selecting the right online Stocks Investment Platforms trading brokerage requires careful consideration of several critical factors. Here are some essential points to keep in mind:
- Ensure your chosen Stocks Investment Platforms broker has a solid track record of at least two years in the industry.
- Verify that the Stocks Investment Platforms broker has a customer support team of at least 15 members responsive to queries and concerns.
- Check if the Stocks Investment Platforms broker operates under the regulatory framework of a jurisdiction that can hold it accountable for any misconduct or resolve disputes fairly and impartially.
- Ensure that the Stocks Investment Platforms broker can process deposits and withdrawals within two to three days, which is crucial when you need to access your funds quickly.
- Look for Stocks Investment Platforms brokers with an international presence in multiple countries, offering its clients local seminars and training programs.
- Ensure the Stocks Investment Platforms broker can hire staff from diverse locations worldwide who can communicate fluently in your local language.
Our team have listed brokers that match your criteria for you below. All brokerage data has been summarised into a comparison table. Scroll down.
Compare Key Features of Stocks Investment Platforms in Our Brokerage Comparison Table
When choosing a broker for Stocks Investment Platforms trading, it's essential to compare the different options available to you. Our Stocks Investment Platforms brokerage comparison table below allows you to compare several important features side by side, making it easier to make an informed choice.
- Minimum deposit requirement for opening an account with each Stocks Investment Platforms broker.
- The funding methods available for Stocks Investment Platforms with each broker.
- The types of instruments you can trade with each Stocks Investment Platforms broker, such as forex, stocks, commodities, and indices.
- The trading platforms each Stocks Investment Platforms broker provides, including their features, ease of use, and compatibility with your devices.
- The spread type (if applicable) for each Stocks Investment Platforms broker affects the cost of trading.
- The level of customer support each Stocks Investment Platforms broker offers, including their availability, responsiveness, and quality of service.
- Whether each Stocks Investment Platforms broker offers Micro, Standard, VIP, or Islamic accounts to suit your trading style and preferences.
By comparing these essential features, you can choose a Stocks Investment Platforms broker that best suits your needs and preferences for Stocks Investment Platforms. Our Stocks Investment Platforms broker comparison table simplifies the process, allowing you to make a more informed decision.
Top 15 Stocks Investment Platforms of 2025 compared
Here are the top Stocks Investment Platforms.
Compare Stocks Investment Platforms brokers for min deposits, funding, used by, benefits, account types, platforms, and support levels. When searching for a Stocks Investment Platforms broker, it's crucial to compare several factors to choose the right one for your Stocks Investment Platforms needs. Our comparison tool allows you to compare the essential features side by side.
All brokers below are Stocks Investment Platforms. Learn more about what they offer below.
You can scroll left and right on the comparison table below to see more Stocks Investment Platforms that accept Stocks Investment Platforms clients.
| Broker |
IC Markets

|
Roboforex

|
eToro

|
XTB

|
XM

|
Pepperstone

|
AvaTrade

|
FP Markets

|
EasyMarkets

|
SpreadEx

|
FXPro

|
|---|---|---|---|---|---|---|---|---|---|---|---|
| Rating | |||||||||||
| Regulation | Seychelles Financial Services Authority (FSA) (SD018) | RoboForex Lid is regulated by Belize FSC, License No. 000138/7, reg. number 000001272. RoboForex Ltd, which is an (A category) member of The Financial Commission, also is a participant of its Compensation Fund | FCA (Financial Conduct Authority) eToro (UK) Ltd (FCA reference 583263), eToro (Europe) Ltd CySEC (Cyprus Securities Exchange Commission), ASIC (Australian Securities and Investments Commission) eToro AUS Capital Limited ASIC license 491139, CySec (Cyprus Securities and Exchange Commission under the license 109/10), FSAS (Financial Services Authority Seychelles) eToro (Seychelles) Ltd license SD076 | FCA (Financial Conduct Authority reference 522157), CySEC (Cyprus Securities and Exchange Commission reference 169/12), FSCA (Financial Sector Conduct Authority), XTB AFRICA (PTY) LTD licensed to operate in South Africa, KPWiG (Polish Securities and Exchange Commission), DFSA (Dubai Financial Services Authority), DIFC (Dubai International Financial Center), CNMV (Comisión Nacional del Mercado de Valores), KNF (Komisja Nadzoru Finansowego), IFSC (Belize International Financial Services Commission license number IFSC/60/413/TS/19) | Financial Services Commission (FSC) (000261/4) XM ZA (Pty) Ltd, Cyprus Securities and Exchange Commission (CySEC) (license 120/10) Trading Point of Financial Instruments Ltd, Australian Securities and Investments Commission (ASIC) (number 443670) Trading Point of Financial Instruments Pty Ltd | Financial Conduct Authority (FCA), Australian Securities and Investments Commission (ASIC), Cyprus Securities and Exchange Commission (CySEC), Federal Financial Supervisory Authority (BaFin), Dubai Financial Services Authority (DFSA), Capital Markets Authority of Kenya (CMA), Pepperstone Markets Limited is incorporated in The Bahamas (number 177174 B), Licensed by the Securities Commission of the Bahamas (SCB) number SIA-F217 | Australian Securities and Investments Commission (ASIC) Ava Capital Markets Australia Pty Ltd (406684), South African Financial Sector Conduct Authority (FSCA) Ava Capital Markets Pty Ltd (45984), Financial Services Agency (Japan FSA) Ava Trade Japan K.K. (1662), Financial Futures Association of Japan (FFAJ),, FFAJ, Abu Dhabi Global Markets (ADGM)(190018) Ava Trade Middle East Ltd (190018), Polish Financial Supervision Authority (KNF) AVA Trade EU Ltd, Central Bank of Ireland (C53877) AVA Trade EU Ltd, British Virgin Islands Financial Services Commission (BVI) BVI (SIBA/L/13/1049), Israel Securities Association (ISA) (514666577) ATrade Ltd, Financial Regulatory Services Authority (FRSA) | CySEC (Cyprus Securities and Exchange Commission) (371/18), ASIC AFS (Australian Securities and Investments Commission) (286354), FSP (Financial Sector Conduct Authority in South Africa) (50926), Financial Services Authority Seychelles (FSA) (130) | Cyprus Securities and Exchange Commission (CySEC) (079/07) Easy Forex Trading Ltd, Australian Securities and Investments Commission (ASIC) (Easy Markets Pty Ltd 246566), British Virgin Islands Financial Services Commission (BVI) EF Worldwide Ltd (SIBA/L/20/1135), Financial Sector Conduct Authority South Africa (FSA) EF Worldwide (PTY) Ltd (54018), FSC (Financial Services Commission) (SIBA/L/20/1135), FSCA (Financial Sector Conduct Authority) (54018) | FCA (Financial Conduct Authority) (190941), Gambling Commission (Great Britain) (8835) | FCA (Financial Conduct Authority) (509956), CySEC (Cyprus Securities and Exchange Commission) (078/07), FSCA (Financial Sector Conduct Authority) (45052), SCB (Securities Commission of The Bahamas) (SIA-F184), FSA (Financial Services Authority of Seychelles) (SD120) |
| Min Deposit | 200 | 10 | 50 | No minimum deposit | 5 | No minimum deposit | 100 | 100 | 25 | No minimum deposit | 100 |
| Funding |
|
|
|
|
|
|
|
|
|
|
|
| Used By | 200,000+ | 730,000+ | 35,000,000+ | 1,000,000+ | 10,000,000+ | 400,000+ | 400,000+ | 200,000+ | 250,000+ | 60,000+ | 7,800,000+ |
| Benefits |
|
|
|
|
|
|
|
|
|
|
|
| Accounts |
|
|
|
|
|
|
|
|
|
|
|
| Platforms | MT5, MT4, MetaTrader WebTrader, Mobile Apps, iOS (App Store), Android (Google Play), MetaTrader iPhone/iPad, MetaTrader Android Google Play, MetaTrader Mac, cTrader, cTrader Web, cTrader iPhone/iPad, cTrader iMac, cTrader Android Google Play, cTrader Automate, cTrader Copy Trading, TradingView, Virtual Private Server, Trading Servers, MT4 Advanced Trading Tools, IC Insights, Trading Central | MT4, MT5, R Mobile Trader, R StocksTrader, WebTrader, Mobile Apps, iOS (App Store), Android (Google Play), Windows | eToro Trading App, Mobile Apps, iOS (App Store), Android (Google Play), CopyTrading, Web | MT4, Mirror Trader, Web Trader, Tablet, Mobile Apps, iOS (App Store), Android (Google Play) | MT5, MT5 WebTrader, XM Apple App for iPhone, XM App for Android Google Play, Tablet: MT5 for iPad, MT5 for Android Google Play, XM App for iPad, XM App for iOS (App Store), Android (Google Play), Mobile Apps | MT4, MT5, cTrader,WebTrader, TradingView, Windows, Mobile Apps, iOS (App Store), Android (Google Play) | MT4, MT5, Web Trading, AvaTrade App, AvaOptions, Mac Trading, AvaSocial, Mobile Apps, iOS (App Store), Android (Google Play) | MT4, MT5, TradingView, cTrader, WebTrader, Mobile Trader, Mobile Apps, iOS (App Store), Android (Google Play) | easyMarkets App, Mobile Apps, iOS (App Store), Android (Google Play), Web Platform, TradingView, MT4, MT5 | Web, Mobile Apps, iOS (App Store), Android (Google Play), iPad App, iPhone App, TradingView | MT4, MT5, cTrader, FxPro WebTrader, FxPro Mobile Apps, iOS (App Store), Android (Google Play) |
| Support |
|
|
|
|
|
|
|
|
|
|
|
| Learn More |
Sign
Up with icmarkets |
Sign
Up with roboforex |
Sign
Up with etoro |
Sign
Up with xtb |
Sign
Up with xm |
Sign
Up with pepperstone |
Sign
Up with avatrade |
Sign
Up with fpmarkets |
Sign
Up with easymarkets |
Sign
Up with spreadex |
Sign
Up with fxpro |
| Risk Warning | Losses can exceed deposits | Losses can exceed deposits | 61% of retail investor accounts lose money when trading CFDs with this provider. | 69% - 80% of retail investor accounts lose money when trading CFDs with this provider. You should consider whether you understand how CFDs work and whether you can afford to take the high risk of losing your money. | CFDs are complex instruments and come with a high risk of losing money rapidly due to leverage. 74.12% of retail investor accounts lose money when trading CFDs with this provider. You should consider whether you understand how CFDs work and whether you can afford to take the high risk of losing your money. | 75-95 % of retail investor accounts lose money when trading CFDs | 71% of retail investor accounts lose money when trading CFDs with this provider | Losses can exceed deposits | Your capital is at risk | 65% of retail CFD accounts lose money | 75.78% of retail investor accounts lose money when trading CFDs and Spread Betting with this provider |
| Demo |
IC Markets Demo |
Roboforex Demo |
eToro Demo |
XTB Demo |
XM Demo |
Pepperstone Demo |
AvaTrade Demo |
FP Markets Demo |
easyMarkets Demo |
SpreadEx Demo |
FxPro Demo |
| Excluded Countries | US, IR, CA, NZ, JP | AU, BE, BQ, BR, CA, CW, CZ, DE, ES, EE, EU, FM, FR, FI, GW, ID, IR, JP, LR, MP, NL, PF, PL, RU, SE, SJ, SS, SL, SI, TL, TR, DO, US, IT, AT, PT, BG, HR, CY, DK, FL, GR, IE, LV, LT, MT, RO, SK, CH | ZA, ID, IR, KP, BE, CA, JP, SY, TR, IL, BY, AL, MD, MK, RS, GN, CD, SD, SA, ZW, ET, GH, TZ, LY, UG, ZM, BW, RW, TN, SO, NA, TG, SL, LR, GM, DJ, CI, PK, BN, TW, WS, NP, SG, VI, TM, TJ, UZ, LK, TT, HT, MM, BT, MH, MV, MG, MK, KZ, GD, FJ, PT, BB, BM, BS, AG, AI, AW, AX, LB, SV, PY, HN, GT, PR, NI, VG, AN, CN, BZ, DZ, MY, KH, PH, VN, EG, MN, MO, UA, JO, KR, AO, BR, HR, GL, IS, IM, JM, FM, MC, NG, SI, | US, IN, PK, BD, NG , ID, BE, AU | US, CA, IL, IR | AF, AS, AQ, AM, AZ, BY, BE, BZ, BT, BA, BI, CM, CA, CF, TD, CG, CI, ER, GF, PF, GP, GU, GN, GW, GY, HT, VA, IR, IQ, JP, KZ, LB, LR, LY, ML, MQ, YT, MZ, MM, NZ, NI, KP, PS, PR, RE, KN, LC, VC, WS, SO, GS, KR, SS, SD, SR, SY, TJ, TN, TM, TC, US, VU, VG, EH, ES, YE, ZW, ET | BE, BR, KP, NZ, TR, US, CA, SG | US, JP, NZ | US, IL, BC, MB, QC, ON, AF, BY, BI, KH, KY, TD, KM, CG, CU, CD, GQ, ER, FJ, GN, GW, HT, IR, IQ, LA, LY, MZ, MM, NI, KP, PW, PA, RU, SO, SS, SD, SY, TT, TM, VU, VE, YE | US, TR | US, CA, IR |
All Stocks Investment Platforms in more detail
You can compare Stocks Investment Platforms ratings, min deposits what the the broker offers, funding methods, platforms, spread types, customer support options, regulation and account types side by side.
We also have an indepth Top Stocks Investment Platforms for 2025 article further below. You can see it now by clicking here
We have listed top Stocks Investment Platforms below.
All Time High Stocks Table of Contents
- All Time High Stocks Explained
- 6 Factors to Consider when Choosing All Time High Stocks
- Are Your All Time High Stocks Trusted And Established?
- Are The All Time High Stocks World Leading?
- What are the All Time High Stocks Commissions and Fees?
- What are the All Time High Stocks Funding and Withdrawl Methods?
- Find All Time High Stocks with Round-the-clock support?
- Make sure the All Time High Stocks Offer Comprehensive Trader resources?
- Why All Time High Stocks needs to be regulated?
- All Time High Stocks FAQ
- What are the best Stocks Investment Platforms brokers?
- What is the best Stocks Investment Platform broker?
- Related All Time High Stocks Reviews
- Related All Time High Stocks Alternatives
- Related All Time High Stocks Comparisons
All Time High Stocks Explained
Trading volatile financial markets with All Time High Stocks can be challenging, even for experienced traders. In addition to the online educational resources available, traders should consider the platform offered by All Time High Stocks to ensure a successful trading experience.
Selecting All Time High Stocks at the forefront of innovation and considered an industry leader is crucial. Doing so will ensure you are equipped with the tools and features to navigate volatile All Time High Stocks markets effectively.
Reliability is key to gaining access to financial markets. Look for All Time High Stocks that you can rely on to provide a stable and secure trading environment, allowing you to execute trades with All Time High Stocks confidently.
6 Factors to Consider when Choosing All Time High Stocks
Follow these five rules for selecting All Time High Stocks that are right for you:
Are Your All Time High Stocks Trusted And Established?
Search for a reputable All Time High Stocks with a extensive proven track record for All Time High Stocks, enabling you to focus solely on implementing your trading strategy and navigating the markets with confidence. The top rated All Time High Stocks broker is IC Markets. Established in 2007, and in operation for 18 years IC Markets have a head office in Australia.
IC Markets is regulated. This means IC Markets are supervised by and is checked for conduct by Seychelles Financial Services Authority (FSA) (SD018) regulatory bodies.
Another top rated broker is Roboforex.
Roboforex was established 2009, and in operation for 16 years Roboforex have a head office in Belize.
Roboforex is regulated. This means Roboforex are supervised by and is checked for conduct by Seychelles Financial Services Authority (FSA) (SD018) regulatory bodies.
| Broker |
IC Markets
|
Roboforex
|
eToro
|
XTB
|
XM
|
Pepperstone
|
AvaTrade
|
FP Markets
|
|---|---|---|---|---|---|---|---|---|
| Year Established | 2007 | 2009 | 2007 | 2002 | 2009 | 2010 | 2006 | 2005 |
| Head Office | Australia | Belize | Cyprus, UK | Poland | Cyprus | Australia | Ireland | Australia |
| Regulation | Seychelles Financial Services Authority (FSA) (SD018) | RoboForex Lid is regulated by Belize FSC, License No. 000138/7, reg. number 000001272. RoboForex Ltd, which is an (A category) member of The Financial Commission, also is a participant of its Compensation Fund | FCA (Financial Conduct Authority) eToro (UK) Ltd (FCA reference 583263), eToro (Europe) Ltd CySEC (Cyprus Securities Exchange Commission), ASIC (Australian Securities and Investments Commission) eToro AUS Capital Limited ASIC license 491139, CySec (Cyprus Securities and Exchange Commission under the license 109/10), FSAS (Financial Services Authority Seychelles) eToro (Seychelles) Ltd license SD076 | FCA (Financial Conduct Authority reference 522157), CySEC (Cyprus Securities and Exchange Commission reference 169/12), FSCA (Financial Sector Conduct Authority), XTB AFRICA (PTY) LTD licensed to operate in South Africa, KPWiG (Polish Securities and Exchange Commission), DFSA (Dubai Financial Services Authority), DIFC (Dubai International Financial Center), CNMV (Comisión Nacional del Mercado de Valores), KNF (Komisja Nadzoru Finansowego), IFSC (Belize International Financial Services Commission license number IFSC/60/413/TS/19) | Financial Services Commission (FSC) (000261/4) XM ZA (Pty) Ltd, Cyprus Securities and Exchange Commission (CySEC) (license 120/10) Trading Point of Financial Instruments Ltd, Australian Securities and Investments Commission (ASIC) (number 443670) Trading Point of Financial Instruments Pty Ltd | Financial Conduct Authority (FCA), Australian Securities and Investments Commission (ASIC), Cyprus Securities and Exchange Commission (CySEC), Federal Financial Supervisory Authority (BaFin), Dubai Financial Services Authority (DFSA), Capital Markets Authority of Kenya (CMA), Pepperstone Markets Limited is incorporated in The Bahamas (number 177174 B), Licensed by the Securities Commission of the Bahamas (SCB) number SIA-F217 | Australian Securities and Investments Commission (ASIC) Ava Capital Markets Australia Pty Ltd (406684), South African Financial Sector Conduct Authority (FSCA) Ava Capital Markets Pty Ltd (45984), Financial Services Agency (Japan FSA) Ava Trade Japan K.K. (1662), Financial Futures Association of Japan (FFAJ),, FFAJ, Abu Dhabi Global Markets (ADGM)(190018) Ava Trade Middle East Ltd (190018), Polish Financial Supervision Authority (KNF) AVA Trade EU Ltd, Central Bank of Ireland (C53877) AVA Trade EU Ltd, British Virgin Islands Financial Services Commission (BVI) BVI (SIBA/L/13/1049), Israel Securities Association (ISA) (514666577) ATrade Ltd, Financial Regulatory Services Authority (FRSA) | CySEC (Cyprus Securities and Exchange Commission) (371/18), ASIC AFS (Australian Securities and Investments Commission) (286354), FSP (Financial Sector Conduct Authority in South Africa) (50926), Financial Services Authority Seychelles (FSA) (130) |
| Used By | 200,000+ | 730,000+ | 35,000,000+ | 1,000,000+ | 10,000,000+ | 400,000+ | 400,000+ | 200,000+ |
| Negative balance protection | Yes | Yes | Yes | Yes | Yes | Yes | Yes | Yes |
| Guaranteed Stop Loss | No | No | No | No | No | Yes | No | No |
| Learn More | Visit IC Markets | Visit Roboforex | Visit eToro | Visit XTB | Visit XM | Visit Pepperstone | Visit AvaTrade | Visit FP Markets |
| Risk Warning | Losses can exceed deposits | Losses can exceed deposits | 61% of retail investor accounts lose money when trading CFDs with this provider. | 69% - 80% of retail investor accounts lose money when trading CFDs with this provider. You should consider whether you understand how CFDs work and whether you can afford to take the high risk of losing your money. | CFDs are complex instruments and come with a high risk of losing money rapidly due to leverage. 74.12% of retail investor accounts lose money when trading CFDs with this provider. You should consider whether you understand how CFDs work and whether you can afford to take the high risk of losing your money. | 75-95 % of retail investor accounts lose money when trading CFDs | 71% of retail investor accounts lose money when trading CFDs with this provider | Losses can exceed deposits |
Are The All Time High Stocks World Leading?
Opt for All Time High Stocks that set themselves apart as an industry leader by actively embracing innovation. Take IC Markets as an example, which is renowned for Segregates clients funds and boasts an extensive array of 2250 tradable instruments. Moreover, IC Markets caters to the needs of its clients with both an online trading platform and a mobile application, making it incredibly convenient to access the markets from anywhere, at any time.
In addition, the IC Markets platform enables access to a variety of financial markets worldwide. IC Markets is a world-leader when it comes to innovation and they are always looking at ways to improve and to maintain their competitive advantage.
Another good choice when looking for All Time High Stocks is Roboforex. Roboforex Segregates clients funds and offers over 12000 instruments.
| Broker |
IC Markets
|
Roboforex
|
eToro
|
XTB
|
XM
|
Pepperstone
|
AvaTrade
|
FP Markets
|
|---|---|---|---|---|---|---|---|---|
| Instruments Available | 2250 | 12000 | 6000 | 6000 | 1000 | 1200 | 1000 | 10000 |
| Platforms | MT5, MT4, MetaTrader WebTrader, Mobile Apps, iOS (App Store), Android (Google Play), MetaTrader iPhone/iPad, MetaTrader Android Google Play, MetaTrader Mac, cTrader, cTrader Web, cTrader iPhone/iPad, cTrader iMac, cTrader Android Google Play, cTrader Automate, cTrader Copy Trading, TradingView, Virtual Private Server, Trading Servers, MT4 Advanced Trading Tools, IC Insights, Trading Central | MT4, MT5, R Mobile Trader, R StocksTrader, WebTrader, Mobile Apps, iOS (App Store), Android (Google Play), Windows | eToro Trading App, Mobile Apps, iOS (App Store), Android (Google Play), CopyTrading, Web | MT4, Mirror Trader, Web Trader, Tablet, Mobile Apps, iOS (App Store), Android (Google Play) | MT5, MT5 WebTrader, XM Apple App for iPhone, XM App for Android Google Play, Tablet: MT5 for iPad, MT5 for Android Google Play, XM App for iPad, XM App for iOS (App Store), Android (Google Play), Mobile Apps | MT4, MT5, cTrader,WebTrader, TradingView, Windows, Mobile Apps, iOS (App Store), Android (Google Play) | MT4, MT5, Web Trading, AvaTrade App, AvaOptions, Mac Trading, AvaSocial, Mobile Apps, iOS (App Store), Android (Google Play) | MT4, MT5, TradingView, cTrader, WebTrader, Mobile Trader, Mobile Apps, iOS (App Store), Android (Google Play) |
| Excluded Countries | US, IR, CA, NZ, JP | AU, BE, BQ, BR, CA, CW, CZ, DE, ES, EE, EU, FM, FR, FI, GW, ID, IR, JP, LR, MP, NL, PF, PL, RU, SE, SJ, SS, SL, SI, TL, TR, DO, US, IT, AT, PT, BG, HR, CY, DK, FL, GR, IE, LV, LT, MT, RO, SK, CH | ZA, ID, IR, KP, BE, CA, JP, SY, TR, IL, BY, AL, MD, MK, RS, GN, CD, SD, SA, ZW, ET, GH, TZ, LY, UG, ZM, BW, RW, TN, SO, NA, TG, SL, LR, GM, DJ, CI, PK, BN, TW, WS, NP, SG, VI, TM, TJ, UZ, LK, TT, HT, MM, BT, MH, MV, MG, MK, KZ, GD, FJ, PT, BB, BM, BS, AG, AI, AW, AX, LB, SV, PY, HN, GT, PR, NI, VG, AN, CN, BZ, DZ, MY, KH, PH, VN, EG, MN, MO, UA, JO, KR, AO, BR, HR, GL, IS, IM, JM, FM, MC, NG, SI, | US, AU, CA, JP, KR, KP, SG, MU, IL, TR, IN, PK, BA, ET, UG, CU, SY, BD, NG, ID, BE, LY, MO, KE, YE, VU, GY, CD, CG, AF, LA, MZ, IQ, IR | US, CA, IL, IR | AF, AS, AQ, AM, AZ, BY, BE, BZ, BT, BA, BI, CM, CA, CF, TD, CG, CI, ER, GF, PF, GP, GU, GN, GW, GY, HT, VA, IR, IQ, JP, KZ, LB, LR, LY, ML, MQ, YT, MZ, MM, NZ, NI, KP, PS, PR, RE, KN, LC, VC, WS, SO, GS, KR, SS, SD, SR, SY, TJ, TN, TM, TC, US, VU, VG, EH, ES, YE, ZW, ET | BE, BR, KP, NZ, TR, US, CA, SG | US, JP, NZ |
| Forex pairs offered | 61 | 35 | 50 | 57 | 55 | 70 | 55 | 70 |
| Forex pairs offered | 61 | 35 | 50 | 57 | 55 | 70 | 55 | 70 |
| Major forex pairs | Yes | Yes | Yes | Yes | Yes | Yes | Yes | Yes |
| Minor forex pairs | Yes | Yes | Yes | Yes | Yes | Yes | Yes | Yes |
| Exotic forex pairs | Yes | Yes | Yes | Yes | Yes | Yes | Yes | Yes |
| Cryptocurrencies (availability subject to regulation) | Yes | No | Yes | No | No | Yes | Yes | Yes |
| Commodities Offered | 20 | 21 | 31 | 21 | 15 | 16 | 17 | 18 |
| Metals | Yes | Yes | Yes | Yes | Yes | Yes | Yes | Yes |
| Energies | Yes | No | Yes | Yes | Yes | Yes | Yes | Yes |
| Agricultural | Yes | No | Yes | Yes | No | Yes | Yes | Yes |
| Stocks Offered | 2100 | 0 | 2042 | 1696 | 160 | 1100 | 1000 | 10000 |
| UK Shares | Yes | Yes | Yes | Yes | Yes | Yes | Yes | Yes |
| US Shares | Yes | Yes | Yes | Yes | Yes | Yes | Yes | Yes |
| German Shares | Yes | Yes | Yes | Yes | Yes | Yes | Yes | Yes |
| Japanese Shares | Yes | Yes | Yes | Yes | Yes | Yes | Yes | Yes |
What are the All Time High Stocks Commissions and Fees?
Ensure that your broker is transparent with fees and those dues are competitive.
The best rated All Time High Stocks broker IC Markets offers competitive offers for Forex, CFDs, Spread Betting, Share dealing, Cryptocurrencies. IC Markets minimum deposit is 200.
Another top rated All Time High Stocks broker Roboforex offers Forex, CFDs. Roboforex minimum deposit is 10. Please note that any cryptocurrency availability with any broker is subject to regulation.
| Broker |
IC Markets
|
Roboforex
|
eToro
|
XTB
|
XM
|
Pepperstone
|
AvaTrade
|
FP Markets
|
|---|---|---|---|---|---|---|---|---|
| Min Deposit | 200 | 10 | 50 | 0 | 5 | 0 | 100 | 100 |
| Withdrawl Fees | No | No | Yes | Yes | No | No | No | No |
| Inactivity Fees | No | No | Yes | Yes | Yes | No | Yes | No |
| Deposit Fees | No | No | No | No | No | No | No | No |
| CFD Commission Fees | Yes | No | Yes | Yes | No | Yes | No | Yes |
What are the All Time High Stocks Funding and Withdrawal Methods?
Efficient and hassle-free funding and withdrawal facilities can significantly improve your overall trading experience when dealing with All Time High Stocks. It streamlines the trading process and helps you focus on making informed decisions rather than worrying about deposit and withdrawal matters with All Time High Stocks.
| Broker |
IC Markets
|
Roboforex
|
eToro
|
XTB
|
XM
|
Pepperstone
|
AvaTrade
|
FP Markets
|
|---|---|---|---|---|---|---|---|---|
| Bank transfer | Yes | Yes | Yes | Yes | Yes | Yes | Yes | Yes |
| Credit Cards | Yes | Yes | Yes | Yes | Yes | Yes | Yes | Yes |
| Paypal | Yes | No | Yes | Yes | No | Yes | Yes | Yes |
| Skrill | Yes | No | Yes | Yes | No | Yes | No | Yes |
| Payoneer | No | Yes | No | Yes | No | Yes | Yes | No |
| Neteller | Yes | Yes | Yes | Yes | Yes | Yes | Yes | Yes |
Find All Time High Stocks with Round-the-clock support?
Effective customer service is an essential factor to consider when dealing with All Time High Stocks.
All Time High Stocks customer service entails various support services to aid customers in making the most cost-effective and appropriate use of the brokers' services.
The customer support options offered by All Time High Stocks can include phone answering services, live chat support, and email customer service support.
IC Markets support a wide range of languages including English, Japanese, Chinese, Polish, Afrikans, Danish, Dutch, German and more
Roboforex support a wide range of languages including English, Chinese Simplified, Chinese Traditional, Indonesian, Malaysian, Portuguese, Spanish, Italian, Polish, Arabic, Thai, Russian, and Ukrainian
IC Markets and Roboforex offer support where clients are able to call or contact the helpdesk via email or a chat service.
| Broker |
IC Markets
|
Roboforex
|
eToro
|
XTB
|
XM
|
Pepperstone
|
AvaTrade
|
FP Markets
|
|---|---|---|---|---|---|---|---|---|
| Support |
|
|
|
|
|
|
|
|
| Languages | English, Japanese, Chinese, Polish, Afrikans, Danish, Dutch, German and more | English, Chinese Simplified, Chinese Traditional, Indonesian, Malaysian, Portuguese, Spanish, Italian, Polish, Arabic, Thai, Russian, and Ukrainian | English, German, Spanish, French, Italian | English, Spanish, Czech, Chinese, German, French, Italian, Polish, Portuguese, Romanian, Slovenian, and Turkish | Arabic, Chinese, English, French, German, Greek, Hindi, Hungarian, Indonesian, Italian, Japanese, Korean, Malay, Polish, Portuguese, Russian, Spanish, Swedish, Thai, and Turkish | English, Spanish, Portuguese, Thai, Russian, Italian, French, German, Polish, Chinese, Vietnamese, and Arabic | Arabic, Simplified Chinese, Traditional Chinese, Dutch, English, Finnish, French, German, Hungarian, Italian, Indonesian, Japanese, Mongolian, Polish, Portuguese, Russian, Spanish, Swedish, Thai, Malay, Korean and Turkish | English, Arabic, Indonesian, Italian, Spanish, French, Russian, Chinese, Japanese, German, Portuguese, Thai, French, Malay, Greek, Vietnamese, Romanian, Turkish, Slovenian, Dutch, Polish, Finnish, Norwegian, Swedish, Serbian, Lithuanian, Hungarian, Galician, Estonian, Danish, Czech, Croatian, Bulgarian, Basque |
| Learn More | Visit IC Markets | Visit Roboforex | Visit eToro | Visit XTB | Visit XM | Visit Pepperstone | Visit AvaTrade | Visit FP Markets |
| Risk Warning | Losses can exceed deposits | Losses can exceed deposits | 61% of retail investor accounts lose money when trading CFDs with this provider. | 69% - 80% of retail investor accounts lose money when trading CFDs with this provider. You should consider whether you understand how CFDs work and whether you can afford to take the high risk of losing your money. | CFDs are complex instruments and come with a high risk of losing money rapidly due to leverage. 74.12% of retail investor accounts lose money when trading CFDs with this provider. You should consider whether you understand how CFDs work and whether you can afford to take the high risk of losing your money. | 75-95 % of retail investor accounts lose money when trading CFDs | 71% of retail investor accounts lose money when trading CFDs with this provider | Losses can exceed deposits |
Make sure the All Time High Stocks Offer Comprehensive Trader resources?
It's important to ensure your All Time High Stocks provide complimentary resources such as analysis, education, and risk management tools. IC Markets and Roboforex collaborate with top analysts to bring the most up-to-date news and insights to traders.
Sound risk and money management are vital to financial market navigation with All Time High Stocks. However, selecting the best broker to access the markets is a critical step that traders should not overlook as they embark on trading live financial markets with All Time High Stocks.
Why All Time High Stocks needs to be regulated?
Regulated All Time High Stocks lowers your risk of loss of deposited trading funds.
Lowering your risk is one of the benefits of working with a properly regulated All Time High Stocks.
Consumers are protected by All Time High Stocks regulation, critical to preventing inadequate services and potential financial harm.
Regulation of All Time High Stocks is necessary to prevent fraud. The All Time High Stocks working capital and client-funded accounts must be kept separate to avoid conducting business with client funds. Any fraudulent behaviour with All Time High Stocks is monitored by financial regulators in the jurisdictions brokers are allowed to operate.
All Time High Stocks List
Funding methods
Bank transfer Credit Card PaypalPlatforms
MT5, MT4, MetaTrader WebTrader, Mobile Apps, iOS (App Store), Android (Google Play), MetaTrader iPhone/iPad, MetaTrader Android Google Play, MetaTrader Mac, cTrader, cTrader Web, cTrader iPhone/iPad, cTrader iMac, cTrader Android Google Play, cTrader Automate, cTrader Copy Trading, TradingView, Virtual Private Server, Trading Servers, MT4 Advanced Trading Tools, IC Insights, Trading CentralCustomer support
Live chat Phone support Email supportAccount Types
Micro account Standard account ECN accountIslamic account VIP account
Funding methods
Bank transfer Credit Card PaypalPlatforms
MT4, MT5, R Mobile Trader, R StocksTrader, WebTrader, Mobile Apps, iOS (App Store), Android (Google Play), WindowsCustomer support
Live chat Phone support Email supportAccount Types
Micro account Standard account ECN accountIslamic account VIP account
eToro is a multi-asset platform which offers both investing in stocks and cryptoassets, as well as trading CFDs.
Please note that CFDs are complex instruments and come with a high risk of losing money rapidly due to leverage. 61% of retail investor accounts lose money when trading CFDs with this provider. You should consider whether you understand how CFDs work, and whether you can afford to take the high risk of losing your money.
This communication is intended for information and educational purposes only and should not be considered investment advice or investment recommendation. Past performance is not an indication of future results.
Copy Trading does not amount to investment advice. The value of your investments may go up or down. Your capital is at risk.
Copy trading is a portfolio management service, provided by eToro (Europe) Ltd., which is authorised and regulated by the Cyprus Securities and Exchange Commission.
Cryptoasset investing is highly volatile and unregulated in some EU countries. No consumer protection. Tax on profits may apply.
Don't invest unless you're prepared to lose all the money you invest. This is a high-risk investment, and you should not expect to be protected if something goes wrong. Take 2 mins to learn more.
eToro USA LLC does not offer CFDs and makes no representation and assumes no liability as to the accuracy or completeness of the content of this publication, which has been prepared by our partner utilizing publicly available non-entity specific information about eToro.
Funding methods
Bank transfer Credit Card PaypalPlatforms
eToro Trading App, Mobile Apps, iOS (App Store), Android (Google Play), CopyTrading, WebCustomer support
Live chat Phone support Email supportAccount Types
Micro account Standard account ECN accountIslamic account VIP account
Funding methods
Bank transfer Credit Card PaypalPlatforms
MT4, Mirror Trader, Web Trader, Tablet, Mobile Apps, iOS (App Store), Android (Google Play)Customer support
Live chat Phone support Email supportAccount Types
Micro account Standard account ECN accountIslamic account VIP account
Funding methods
Bank transfer Credit Card PaypalPlatforms
MT5, MT5 WebTrader, XM Apple App for iPhone, XM App for Android Google Play, Tablet: MT5 for iPad, MT5 for Android Google Play, XM App for iPad, XM App for iOS (App Store), Android (Google Play), Mobile AppsCustomer support
Live chat Phone support Email supportAccount Types
Micro account Standard account ECN accountIslamic account XM Swap-Free account (XM Ultra Low Account) VIP account
Funding methods
Bank transfer Credit Card PaypalPlatforms
MT4, MT5, cTrader,WebTrader, TradingView, Windows, Mobile Apps, iOS (App Store), Android (Google Play)Customer support
Live chat Phone support Email supportAccount Types
Micro account Standard account ECN accountIslamic account Pro Account VIP account
Funding methods
Bank transfer Credit Card PaypalPlatforms
MT4, MT5, Web Trading, AvaTrade App, AvaOptions, Mac Trading, AvaSocial, Mobile Apps, iOS (App Store), Android (Google Play)Customer support
Live chat Phone support Email supportAccount Types
Micro account Standard account ECN accountIslamic account VIP account
Funding methods
Bank transfer Credit Card PaypalPlatforms
MT4, MT5, TradingView, cTrader, WebTrader, Mobile Trader, Mobile Apps, iOS (App Store), Android (Google Play)Customer support
Live chat Phone support Email supportAccount Types
Micro account Standard account ECN accountIslamic account VIP account
Funding methods
Bank transfer Credit Card PaypalPlatforms
easyMarkets App, Mobile Apps, iOS (App Store), Android (Google Play), Web Platform, TradingView, MT4, MT5Customer support
Live chat Phone support Email supportAccount Types
Micro account Standard account ECN accountIslamic account VIP account
Funding methods
Bank transfer Credit Card PaypalPlatforms
Web, Mobile Apps, iOS (App Store), Android (Google Play), iPad App, iPhone App, TradingViewCustomer support
Live chat Phone support Email supportAccount Types
Micro account Standard account ECN accountIslamic account VIP account
Funding methods
Bank transfer Credit Card PaypalPlatforms
MT4, MT5, cTrader, FxPro WebTrader, FxPro Mobile Apps, iOS (App Store), Android (Google Play)Customer support
Live chat Phone support Email supportAccount Types
Micro account Standard account ECN accountIslamic account VIP account

Learn more
Losses can exceed deposits

Losses can exceed deposits