Dogs of the Dow Table of Contents
- Dogs of the Dow
- Dogs of the Dow Strategy Methodology
- Dogs of the Dow Idea
- Dogs of the Dow Performance
- Portfolio Performance Comparison 1996 – 2006 and 1996 – 2016 Annuity
- $10K Annuity Investment Comparison Chart
- Dogs of the Dow in 2026
- Dogs of the Dow FAQ
- What is Dogs of the Dow?
- Dogs of the Dow performace
- Dogs of the Dow 2026 Outlook
Dogs Of The Dow In Detail
Dogs of the Dow
There are many different investment strategies that traders have utilised to build wealth in the financial markets. Dogs of the Dow has been a popular method since 1991 when it was first published.
Dogs of the Dow works to maximize investment yields by following the strategy of buying the highest paying dividend stocks available on the Dow Jones Industrial Average (DJIA).
Analysing the DJIA track record over the past decade, the Dogs of the Dow strategy has averaged higher than the index.
It is important to note that the strategy needs balancing again and again at the beginning of each year.
Dogs of the Dow Strategy Methodology
Usually, the dividends of blue chip companies are not altered and do not reflect trading conditions. The Dogs of the Dow methodology relies on this.
Throughout the business cycle the prices of stock fluctuate. This means companies with high dividends relative to the prices of stock are almost at the lowest level of their business cycle.
As a result, the stock price of the company may rise quicker compared to the companies having low dividend yields.
Under such circumstances, the traders who are reinvesting in the high-dividend companies should outperform the market.
Investors are basically attracted to dividend stocks due to their current income as well as their growth potential. This is not surprising.
Dogs of the Dow Idea
The idea of Dogs of the Dow was conceptualized to make stock picking safe and easy.
On December 31st, select the 10-highest dividend-yielding stocks and on January 1 an equal dollar amount is invested in each of the stocks.
Next, hold these for one year and repeat the process year after year on the last day and first day of each year.
However, most nonprofessionals may not find investing so simple, hence the Dogs of the Dow strategy was devised.
Dogs of the Dow is a long-term strategy and requires low maintenance. It mimics the DJIA performance. In the long-run, the results look the same. Dow outperforms Dogs sometimes and Dogs too outperforms Dow. Dogs of the Dow’s performance has found it to be a valid strategy over time.
Dogs of the Dow Performance
Greater losses were experienced with the Dogs of the Dow strategy during the 2008 recession, but over the period of the next ten years, it outperformed the DJIA.
According to an Investopedia article, an account that started with $10,000 on January 1 in 2008 ended up with $17,350 by the end of 2018. That is a 73% rise over 10 years.
On the other foot, investors who followed the Dogs of the Dow strategy found a big difference in the dividend payments and their wrap-up balance in 2018 was $21,420. That is a 114% increase over 10 years [Source].
The International Journal of Trade, Economics and Finance released research examining the risk adjusted investment performance of three versions of the Dogs of Dow relative to the broader Dow Jones Industrial Average.
The study written by Eric C. Lin showed that Dogs of Dow strategies provided better returns than the Dow Index over time.
Portfolio Performance Comparison 1996 – 2006 and 1996 – 2016 Annuity
| Returns | DJIA | DOW 10 | DOW 5 | Small Dogs |
| Geometic Return | 6.23% | 6.91% | 7.13% | 7.75% |
| Arithmetic Return | 7.30% | 8.06% | 8.72% | 9.47% |
| Total Return | 355.6% | 406.6% | 425% | 479.1% |
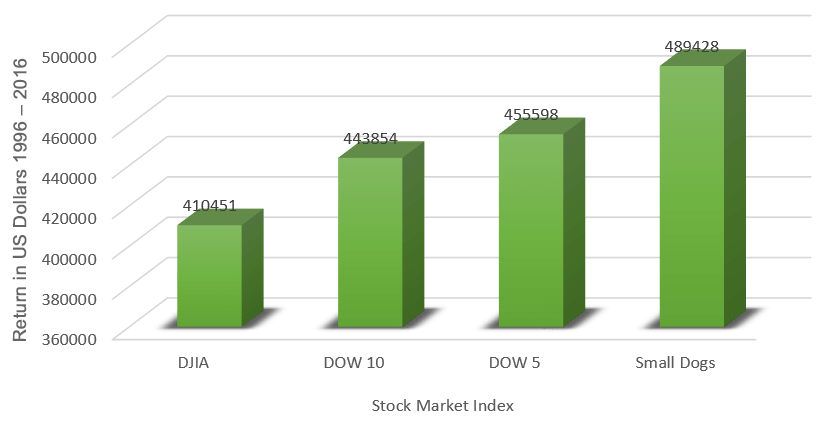
| FV of $10K Annuity | $410,451 | $443,854 | $455,598 | $489,428 |
The table above presents the investment performance of Dogs of DOW portfolios.
The table shows DJIA Index performance falls behind that of the Dogs of the Dow.
The geometric return is a mathematical average used to illustrate annual return rates in the table.
The geometric return for DJIA was 6.23% from 1996 to 2006, while the Dow-10 was 6.91% and Small Dogs of the Dow was 7.75%.
The compounded percentage returns also illustrate favorable returns of Dogs of the Dow.
The final row of the Table displays the total dollar value of the portfolio.
Annuity values grew to $410,451 from 1996 to 2016 with annual contributions of $10k [Source].
$10K Annuity Investment Comparison Chart
Dogs of the Dow in 2020
Dogs of the Dow 2019 performance was not impressive. Dogs of the Dow returns fell short from what was expected.
In 2020 things may improve. If the prices of oil rebound, the strategy may recover.
Dark Pools FAQ
What is Dogs of the Dow?
Dogs of the Dow is an investment strategy first published in 1991. Dogs of the Dow by following the strategy of buying the highest paying dividend stocks available on the Dow Jones Industrial Average (DJIA). Analysing the DJIA track record over the past decade, the Dogs of the Dow strategy has averaged higher than the DJIA index.
Dogs of the Dow performace
More recent market research indicates that the long-term annualised return of the Dow Jones Industrial Average (DJIA), including dividends, has been approximately 7% to 8% per year from the late 1990s through 2024. Back tested performance suggests that the Dogs of the Dow and Small Dogs strategies have, in some periods, delivered slightly higher historical average returns, although results vary by decade and are not guaranteed. Based on these historical returns, annual contributions of $10,000 from 1996 to 2024 could have grown to an estimated $750,000 to $820,000, depending on fees, contribution timing and dividend reinvestment.
Dogs of the Dow 2026 Outlook
Dogs of the Dow performance has been mixed in recent years. The strategy declined by around 1% in 2022, rebounded strongly with double digit gains in 2023, and showed more moderate performance in 2024. Outlooks for 2026 will depend on broader economic conditions, including interest rates, corporate earnings and sector performance. If value oriented, dividend paying blue chip stocks continue to strengthen, the strategy may benefit however, future returns are uncertain and not guaranteed.

